Comparative Study
. 2005 Feb;169(2):945-53.
doi: 10.1534/genetics.104.034959. Epub 2004 Oct 16.

Nucleotide polymorphism and linkage disequilibrium within and among natural populations of European aspen (Populus tremula L., Salicaceae)

Affiliations
Comparative Study

Nucleotide polymorphism and linkage disequilibrium within and among natural populations of European aspen (Populus tremula L., Salicaceae)

Pär K Ingvarsson. Genetics. 2005 Feb.

Abstract

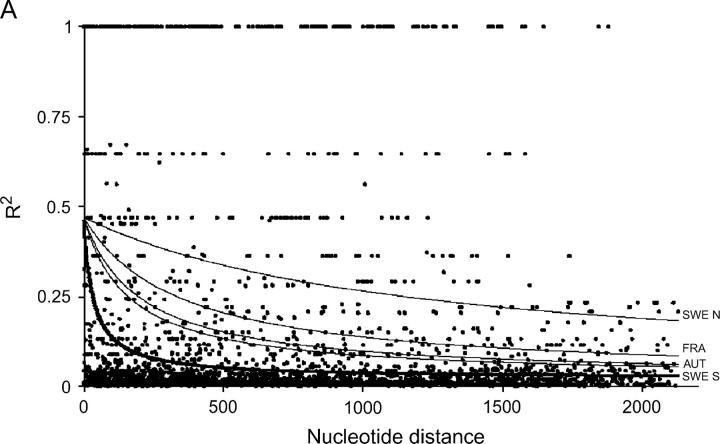
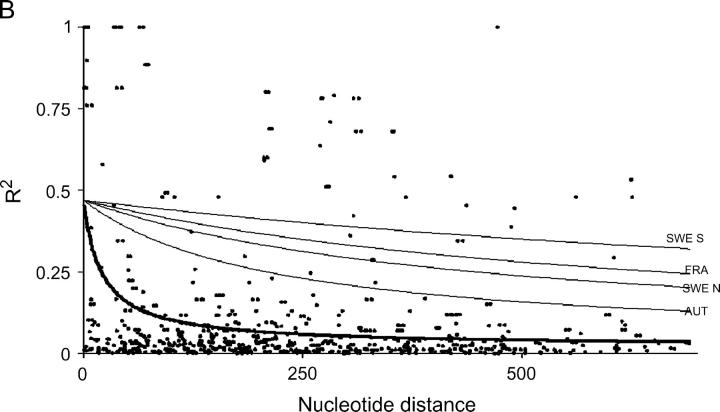
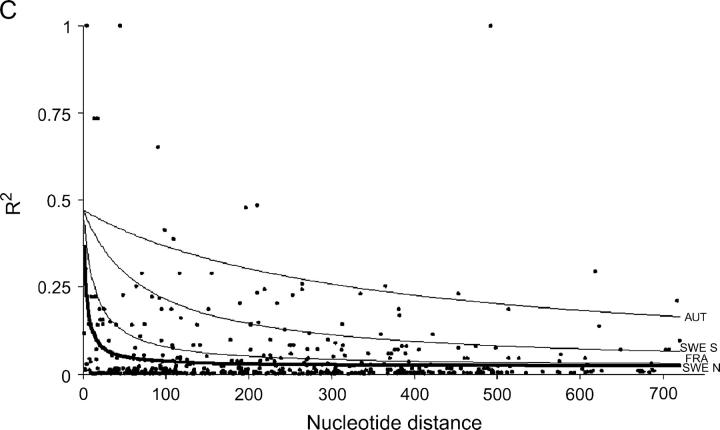
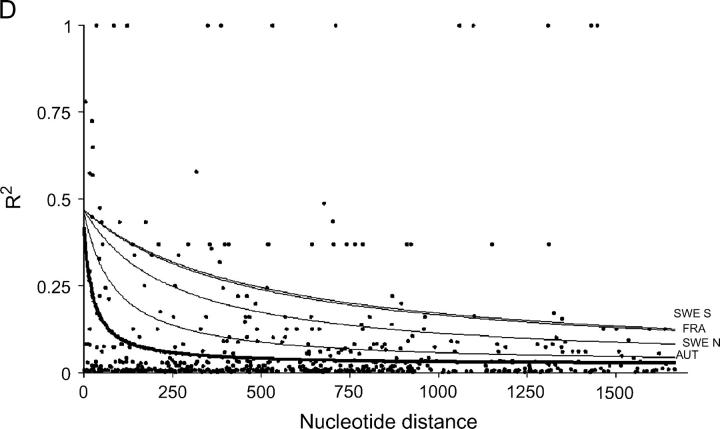
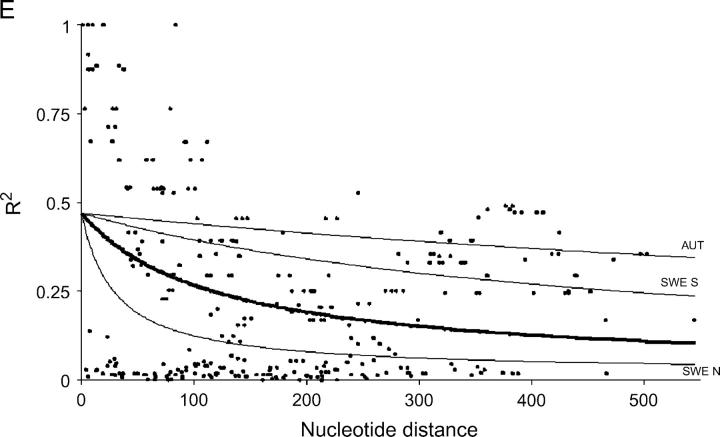
Populus is an important model organism in forest biology, but levels of nucleotide polymorphisms and linkage disequilibrium have never been investigated in natural populations. Here I present a study on levels of nucleotide polymorphism, haplotype structure, and population subdivision in five nuclear genes in the European aspen Populus tremula. Results show substantial levels of genetic variation. Levels of silent site polymorphisms, pi(s), averaged 0.016 across the five genes. Linkage disequilibrium was generally low, extending only a few hundred base pairs, suggesting that rates of recombination are high in this obligate outcrossing species. Significant genetic differentiation was found at all five genes, with an average estimate of F(ST) = 0.116. Levels of polymorphism in P. tremula are 2- to 10-fold higher than those in other woody, long-lived perennial plants, such as Pinus and Cryptomeria. The high levels of nucleotide polymorphism and low linkage disequilibrium suggest that it may be possible to map functional variation to very fine scales in P. tremula using association-mapping approaches.


Figures

F<sc>igure</sc> 1.—
Figure 1.—
Plots showing the squared correlations of allele frequencies (r2) as a function of physical distance between sites for five genes in Populus tremula: (A) Adh1, (B) CI-1, (C) GA20ox1, (D) Gapdh, and (E) TI-3. The thick lines are fitted nonlinear regressions of the mutation-recombination-drift model given in Equation 1. Thin lines depict within-population decline in linkage disequilibrium (also fitted using Equation 1). It was not possible to fit Equation 1 for the FRA sample from TI-3 due to the low number of informative sites.

References

    1. Aguade, M., 2001. Nucleotide sequence variation at two genes of the phenylpropanoid pathway, the FAH1 and F3H genes in Arabidopsis thaliana. Mol. Biol. Evol. 18: 1–9. - PubMed
    1. Blumenthal, B. E., 1942. Studier angående aspens förekomst i Finland. Silv. Fenn. 56: 1–63.
    1. Brunner, A. M., V. B. Busov and S. H. Strauss, 2004. Poplar genome sequence: functional genomics in an ecologically dominant plant species. Trends Plant Sci. 9: 49–56. - PubMed
    1. Charlesworth, B., 1998. Measures of divergence between populations and the effects of forces that reduce variability. Mol. Biol. Evol. 15: 538–543. - PubMed
    1. Charlesworth, D., 2003. Effects of inbreeding on the genetic diversity of populations. Philos. Trans. R. Soc. Lond. Biol. B Biol. Sci. 358: 1051–1070. - PMC - PubMed

Publication types