. 2004 Oct;114(8):1058-71.
doi: 10.1172/JCI22220.

Atrogin-1/muscle atrophy F-box inhibits calcineurin-dependent cardiac hypertrophy by participating in an SCF ubiquitin ligase complex

Affiliations

Atrogin-1/muscle atrophy F-box inhibits calcineurin-dependent cardiac hypertrophy by participating in an SCF ubiquitin ligase complex

Hui-Hua Li et al. J Clin Invest. 2004 Oct.

Abstract

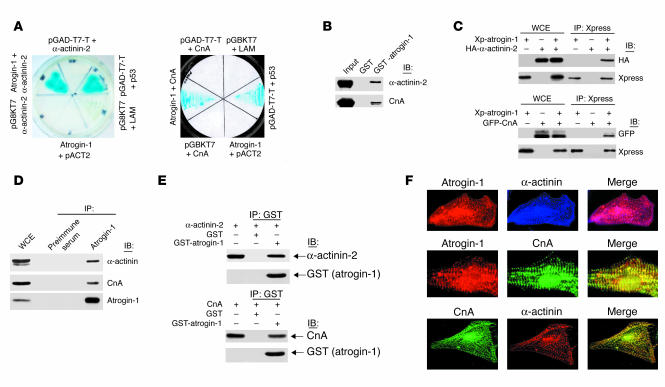
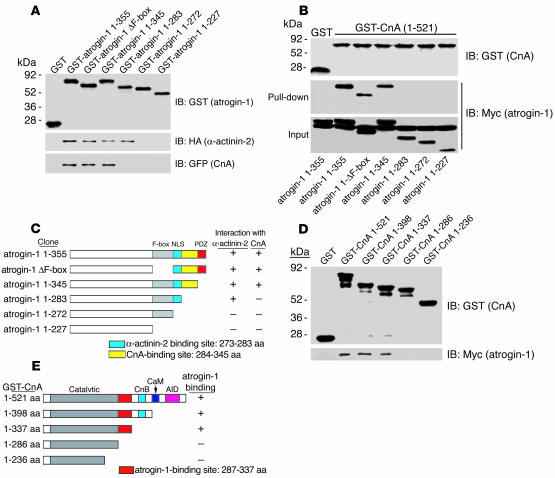
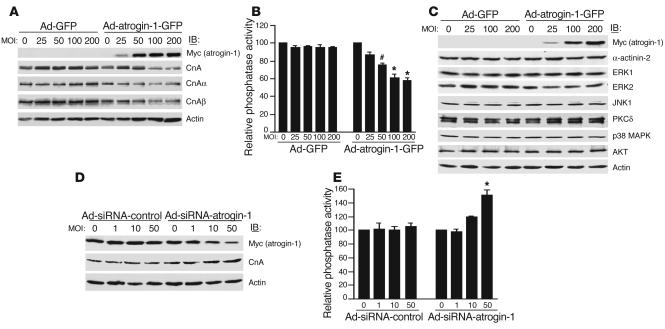
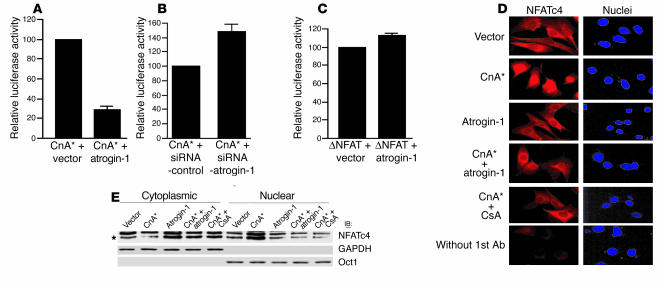
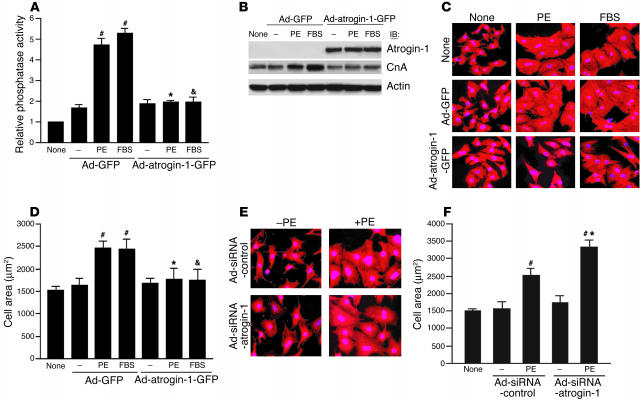
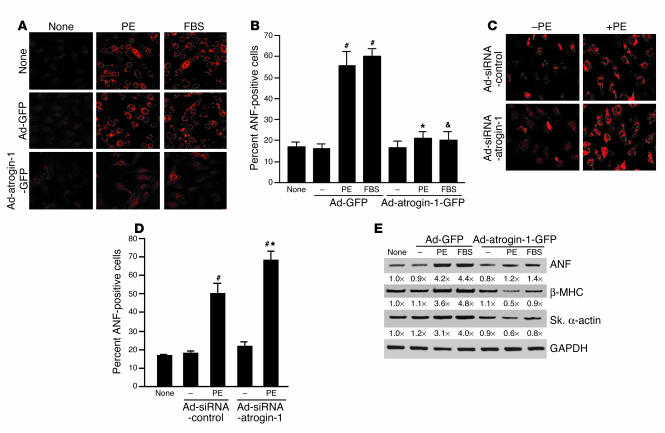
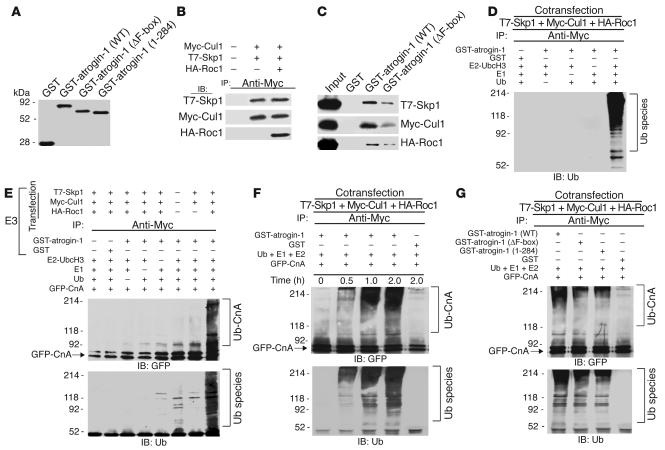
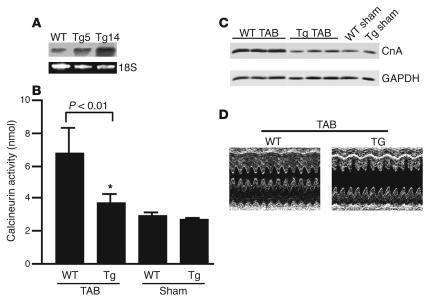
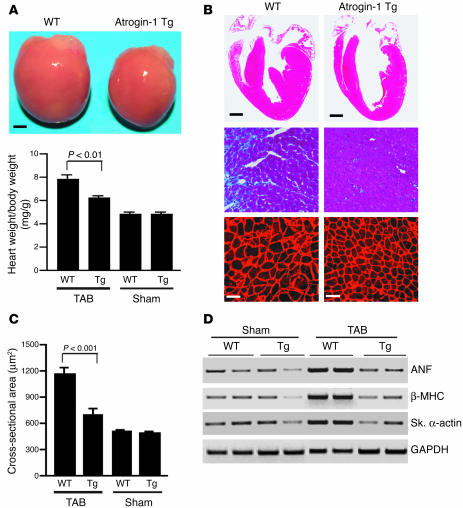
Calcineurin, which binds to the Z-disc in cardiomyocytes via alpha-actinin, promotes cardiac hypertrophy in response to numerous pathologic stimuli. However, the endogenous mechanisms regulating calcineurin activity in cardiac muscle are not well understood. We demonstrate that a muscle-specific F-box protein called atrogin-1, or muscle atrophy F-box, directly interacts with calcineurin A and alpha-actinin-2 at the Z-disc of cardiomyocytes. Atrogin-1 associates with Skp1, Cul1, and Roc1 to assemble an SCF(atrogin-1) complex with ubiquitin ligase activity. Expression of atrogin-1 decreases levels of calcineurin A and promotes its ubiquitination. Moreover, atrogin-1 attenuates agonist-induced calcineurin activity and represses calcineurin-dependent transactivation and NFATc4 translocation. Conversely, downregulation of atrogin-1 using adenoviral small interfering RNA (siRNA) expression enhances agonist-induced calcineurin activity and cardiomyocyte hypertrophy. Consistent with these cellular observations, overexpression of atrogin-1 in hearts of transgenic mice reduces calcineurin protein levels and blunts cardiac hypertrophy after banding of the thoracic aorta. These studies indicate that the SCF(atrogin-1) ubiquitin ligase complex interacts with and represses calcineurin by targeting calcineurin for ubiquitin-mediated proteolysis, leading to inhibition of cardiac hypertrophy in response to pathologic stimuli.


Figures

Figure 1
Figure 1
Molecular interaction of atrogin-1 with α-actinin-2 and calcineurin A (CnA). (A) Yeast 2-hybrid analysis of atrogin-1 interaction with α-actinin-2 (left) and calcineurin A (right). pGBKT7 and pACT2 are empty plasmids. pGAD-T7 vector expresses a T antigen–GAL4 activation domain fusion that interacts with p53 (positive control reaction). (B) In vitro interactions of atrogin-1 with α-actinin-2 and calcineurin A in GST pull-down assays. The ability of α-actinin-2 (top) or calcineurin A (bottom) expressed in COS-7 cells to be retained by GST or a GST–atrogin-1 fusion protein was analyzed by immunoblotting after binding reactions. (C) COS-7 cells were transfected with Xpress-tagged (Xp) atrogin-1 and GFP-tagged calcineurin A or HA-tagged α-actinin-2 expression plasmids as indicated. Equal amounts of cell extract were immunoprecipitated with the Xpress antibody and analyzed by immunoblotting with antibodies directed against Xpress (to detect atrogin-1) and HA (to detect α-actinin-2, top) or against GFP (to detect calcineurin A, bottom). WCE, whole cell extract. (D) Endogenous protein interactions were examined in cardiomyocyte cell lysates that were immunoprecipitated with preimmune serum or anti–atrogin-1 antibody and analyzed by immunoblotting with antibodies to detect α-actinin (top), calcineurin A (middle), and atrogin-1 (bottom). (E) Direct protein interactions were detected by incubation of GST–atrogin-1 or GST (1 μg) with 1 μg of recombinant calcineurin A or α-actinin-2 proteins. Mixtures were precipitated with anti-GST antibody and analyzed by immunoblotting with antibodies against α-actinin, calcineurin A, and GST. (F) Coimmunostaining analysis of endogenous atrogin-1, calcineurin A, and α-actinin-2 in neonatal cardiomyocytes. The overlay shows that atrogin-1 colocalizes with both α-actinin (top) and calcineurin A (middle).
Figure 2
Figure 2
Mapping the interaction domains of atrogin-1, α-actinin-2, and calcineurin A. (A) The residues of atrogin-1 required for binding to α-actinin-2 and calcineurin A were determined with GST pull-down assays. GST–atrogin-1 fusion proteins were purified and analyzed for expression (top). The ability of the truncated atrogin-1 fusion proteins to bind to calcineurin A (expressed in COS-7 cells as a GFP fusion) and α-actinin-2 (expressed as an HA fusion) was analyzed by blotting with antibodies against HA (middle) and GFP (bottom). (B) GST–calcineurin A was affinity-purified and analyzed by blotting with antibody against GST (top). The pull-down (middle) and input (bottom) fractions of COS-7 cell extracts expressing the indicated Myc-tagged atrogin-1 truncations were immunoblotted with antibodies against Myc. (C) Schematic representation of atrogin-1 truncations that interact with α-actinin-2 and calcineurin A. F-box, F-box domain; NLS, nuclear location sequence; PDZ, PDZ domain. (D) The region of calcineurin A involved in binding to atrogin-1 was analyzed in pull-down assays. GST–calcineurin A fusion proteins were affinity purified and analyzed by blotting with GST antibody (top). The ability of the various calcineurin A fusion proteins to bind to atrogin-1 expressed as a Myc-tagged fusion in COS-7 cells was analyzed by blotting with Myc antibody (bottom). (E) Schematic representations of calcineurin A residues that bind to atrogin-1. CnB, calcineurin B–binding domain; CaM, calmodulin-binding domain; AID, autoinhibitory domain.
Figure 3
Figure 3
Atrogin-1 regulates endogenous calcineurin A levels and activity. (A) Cardiomyocytes were infected with increasing multiplicities of infection (MOI) of Ad-atrogin-1-GFP and Ad-GFP with FBS stimulation for 36 hours. The levels of expressed atrogin-1 and endogenous calcineurin A were determined by immunoblotting with anti-Myc or –calcineurin A antibodies, respectively. An antibody against β-actin was used to assess protein loading. A representative blot is shown for each condition. (B) Calcineurin A phosphatase activity was measured with 5 μg of cell extracts. The data are from 3 independent experiments in duplicate. *P < 0.05, #P < 0.001 vs. Ad-GFP. (C) Adenovirus-infected cardiomyocytes were tested for expression of endogenous α-actinin-2, ERK1, ERK2, JNK1, PKCδ, p38 MAPK, and Akt by immunoblotting with the indicated antibodies. An antibody against β-actin was used to assess protein loading. (D) Cardiomyocytes were infected with increasing MOI of Ad-siRNA-atrogin-1 and Ad-siRNA-control with FBS stimulation for 36 hours, and the levels of expressed atrogin-1 and endogenous calcineurin A were determined by Western blotting. (E) Calcineurin A phosphatase activity was measured in cardiomyocytes infected with Ad-siRNA-atrogin-1 and Ad-siRNA-control. The data are from 3 independent experiments in duplicate. *P < 0.001 vs. Ad-siRNA-control.
Figure 4
Figure 4
Atrogin-1 blocks calcineurin-dependent transcriptional responses and nuclear translocation of NFATc4 but does not inhibit a constitutively active form of NFAT in cardiomyocytes. (A) The calcineurin-dependent transcriptional response was measured in cardiomyocytes by cotransfection of a pIL2-Luc reporter plasmid and active calcineurin A (CnA*) together with atrogin-1 or the empty expression vector as control, and luciferase activity was measured. (B) A pIL2-Luc reporter plasmid and active calcineurin A together with plasmids expressing siRNA-atrogin-1 or siRNA-control were transfected in cardiomyocytes, and luciferase activity was measured. (C) An NFAT-dependent pIL2-Luc reporter plasmid, an expression vector encoding active NFAT (ΔNFAT), and atrogin-1 or the empty expression vector as control were transfected in cardiomyocytes, and luciferase activity was measured. (D) Cardiomyocytes transfected with the indicated plasmids were immunostained 36 hours after transfection with an antibody against NFATc4 (red), and nuclei were counterstained with DAPI (blue). (E) Cardiomyocytes transfected with the indicated plasmids were separated into cytoplasmic and nuclear fractions. Equal amounts of protein were analyzed by immunoblotting with NFATc4, GAPDH, and Oct1 antibodies. GAPDH and Oct1 served as cytoplasmic and nuclear markers, respectively. A representative blot is shown for each condition. CsA, cyclosporin A.
Figure 5
Figure 5
Ad-atrogin-1-GFP infection blocks agonist-induced cardiomyocyte hypertrophy. (A) Cardiomyocytes were infected with Ad-GFP or Ad-atrogin-1-GFP and were stimulated with PE (100 μM) or FBS for 36 hours. Calcineurin phosphatase activity was measured with 5 μg of cell extracts. (B) Cardiomyocytes were cultured and infected with adenoviruses as described above. The levels of expressed atrogin-1 and endogenous calcineurin A protein were determined by immunoblotting with anti-Myc or –calcineurin A antibodies, respectively. (C) Cardiomyocytes were cultured and infected with the indicated adenoviruses. Cells were stained with α-actinin antibody (red), and nuclei were stained with DAPI (blue). A representative field is shown for each condition. Magnification, ×200. (D) Quantitation of cell surface area in C (100–120 random cells measured in each group). #P < 0.001 vs. serum-free control; *P < 0.001 vs. Ad-GFP + PE; &P < 0.001 vs. Ad-GFP + FBS. (E) Cardiomyocytes were infected with Ad-siRNA-control or Ad-siRNA-atrogin-1 and were treated with PE for 36 hours. Cells were stained with α-actinin antibody. A representative field is shown for each condition. Magnification, ×200. (F) Quantitation of cell surface area (100–120 random cells measured in each group). #P < 0.001 vs. serum-free control; *P < 0.001 vs. Ad-siRNA-control + PE.
Figure 6
Figure 6
Ad-atrogin-1-GFP inhibits fetal gene expression in cardiomyocytes. (A) Cardiomyocytes were infected and were stimulated as indicated. Cells were fixed and stained with antibody against ANF (perinuclear red signal). A representative field is shown for each condition. Magnification, ×200. (B) Percentage of ANF-positive cells (100–120 random cells measured in each group). #P < 0.001 vs. serum-free control; *P < 0.001 vs. Ad-GFP + PE; &P < 0.001 vs. Ad-GFP + FBS. (C) Cardiomyocytes were infected with Ad-siRNA-control or Ad-siRNA-atrogin-1 and were stimulated with PE (100 μM) for 36 hours. Cells were fixed and stained with antibody against ANF. Magnification, ×200. (D) Percentage of ANF-positive cells (100–120 random cells measured in each group). #P < 0.001 vs. serum-free control; *P < 0.001 vs. Ad-siRNA-control + PE. (E) Cardiomyocytes were infected with adenoviruses and stimulated as indicated. The transcripts of ANF, β-MHC, and skeletal α-actin (Sk. α-actin) were measured by quantitative RT-PCR. ANF, skeletal α-actin, and β-MHC levels are shown relative to those in untreated, uninfected control cells and normalized to the level of GAPDH below each panel. A representative experiment is shown for each condition.
Figure 7
Figure 7
Atrogin-1 participates in an SCFatrogin-1 complex that ubiquitinates calcineurin A in vitro. (A) GST–atrogin-1 (WT), atrogin-1 ΔF-box, and atrogin-1 1–284 were purified from bacteria. The purity of each purified protein was verified by SDS-PAGE and Coomassie staining. (B) Association of Skp1 and Roc1 with Cul1 was confirmed by cotransfection with T7-Skp1, Myc-Cul1, and HA-Roc1 in COS-7 cells. Equal amounts of cell extract were immunoprecipitated with Myc antibody and analyzed by immuoblotting with antibodies against T7 (Skp1, top), Myc (Cul1, middle), and HA (Roc1, bottom), respectively. (C) Interaction of atrogin-1 with Skp1, Cul1, and Roc1 was analyzed in in vitro GST pull-down assays. The ability of Skp1 (top), Cul1 (middle), and Roc1 (bottom) to bind GST, GST–atrogin-1, or GST–atrogin-1 ΔF-box was analyzed by immunoblotting. (D) The SCFatrogin-1 complex was evaluated for ubiquitin ligase activity in the presence of recombinant E1, UbcH3/CDC34 (E2 UbcH3), and ubiquitin (Ub) as indicated. (E) The SCFatrogin-1 complex was evaluated for its capacity to ubiquitinate purified GFP-tagged calcineurin A. After the in vitro ubiquitylation reaction, the samples were analyzed by immunoblotting with an anti-ubiquitin antibody to identify ubiquitinated products or with an anti-GFP antibody directed to calcineurin A to reveal ubiquitinated calcineurin A species. (F) Purified GFP-tagged calcineurin A was incubated with SCFatrogin-1 complex for the indicated times, and calcineurin A ubiquitination was examined by anti-GFP (top) or anti-ubiquitin (bottom) antibodies. (G) Purified GFP-tagged calcineurin A was incubated with SCFatrogin-1 complex containing atrogin-1 WT, the ΔF-box mutant, or the 1–284 mutant, and calcineurin A ubiquitination was examined by immunoblotting.
Figure 8
Figure 8
Effects of overexpressed atrogin-1 on calcineurin A activity, protein level, and cardiac function. (A) Northern blot analysis of transgene expression. Ten micrograms of total RNA from heart of Tg5 and Tg14 (second and third lanes) and WT (first lane) was analyzed by Northern blotting with a cDNA probe corresponding to a 1.1-kb fragment containing the mouse atrogin-1 coding sequences. The bottom panel corresponds to the ethidium bromide staining of ribosomal 18S RNA of the same RNA sample separated on an identical gel. (B) Eight-week-old mice were subjected to thoracic aortic banding (TAB) or to sham surgery. Fourteen days later, mice were sacrificed, the hearts were freshly isolated from atrogin-1 transgenic (Tg) and nontransgenic control (WT) mice, and calcineurin A activity was determined (n = 7). *P < 0.001 vs. WT. (C) Western blot analysis of calcineurin A and GAPDH protein levels from hearts of WT and transgenic mice was measured 14 days after thoracic aortic banding or sham surgery. Numbers indicate the expression level of calcineurin A in aortic-banded WT and Tg hearts relative to sham-operated WT hearts, normalized to GAPDH. (D) M-mode echocardiographic analysis of hearts from Tg and WT mice.
Figure 9
Figure 9
Atrogin-1 blunts the hypertrophic response to pressure overload. (A) Representative heart sizes and heart weight/body weight ratios of atrogin-1 transgenic mice were compared with those of nontransgenic mice. Eight-week-old mice were subjected to thoracic aortic banding (TAB) or sham surgery. Fourteen days later, animals were sacrificed, the hearts were freshly isolated from transgenic (Tg) and nontransgenic (WT) mice, and heart weight/body weight ratios were determined (n = 7). Scale bar: 1 mm. (B) Representative macroscopic histologic analysis of H&E-stained hearts from indicated mice after 2 weeks of aortic banding is shown (top panels). Scale bar: 1 mm. Histologic sections were also stained with Masson’s trichrome to detect interstitial cell fibrosis in hearts (middle panels; magnification, ×200), and with wheat germ agglutinin–TRITC conjugate to determine cell size (bottom panels; scale bars: 50 μm). (C) Quantitation of myocyte cross-sectional areas from the indicated groups (n = 200 cells per section). (D) Analysis of hypertrophic markers. Total RNA was isolated from hearts of mice of the indicated genotype, and expression of transcripts for ANF, β-MHC, skeletal α-actin, and GAPDH was determined by slot blot analysis. A representative analysis is shown.

References

    1. Molkentin JD. Calcineurin and beyond: cardiac hypertrophic signaling. Circ. Res. 2000;87:731–738. - PubMed
    1. Vakili BA, Okin PM, Devereux RB. Prognostic implications of left ventricular hypertrophy. Am. Heart J. 2001;141:334–341. - PubMed
    1. Chien KR. Stress pathways and heart failure. Cell. 1999;98:555–558. - PubMed
    1. Molkentin JD, et al. A calcineurin-dependent transcriptional pathway for cardiac hypertrophy. Cell. 1998;93:215–228. - PMC - PubMed
    1. Frey N, Richardson JA, Olson EN. Calsarcins, a novel family of sarcomeric calcineurin-binding proteins. Proc. Natl. Acad. Sci. U. S. A. 2000;97:14632–14637. - PMC - PubMed

Publication types

MeSH terms