. 2004 Oct;114(8):1117-27.
doi: 10.1172/JCI22222.

Mitochondrial survivin inhibits apoptosis and promotes tumorigenesis

Affiliations

Mitochondrial survivin inhibits apoptosis and promotes tumorigenesis

Takehiko Dohi et al. J Clin Invest. 2004 Oct.

Abstract

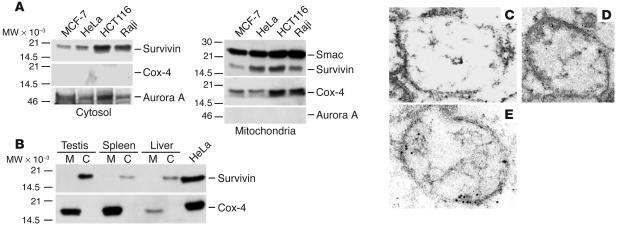
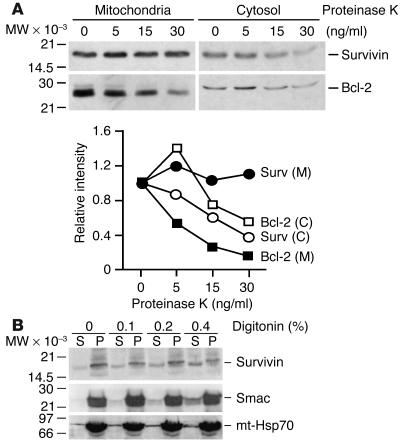
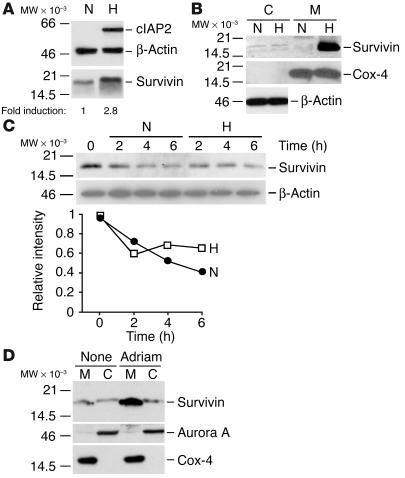
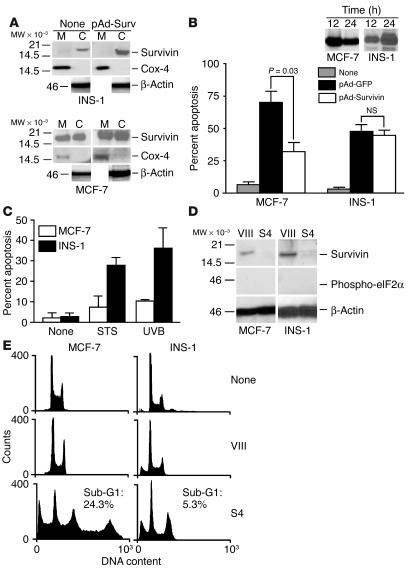
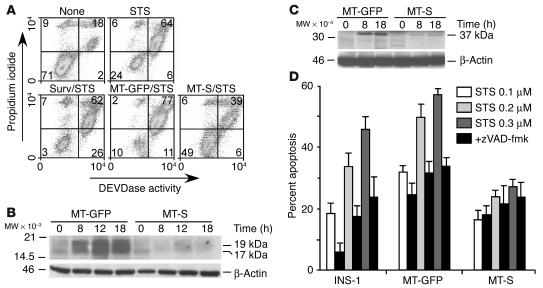
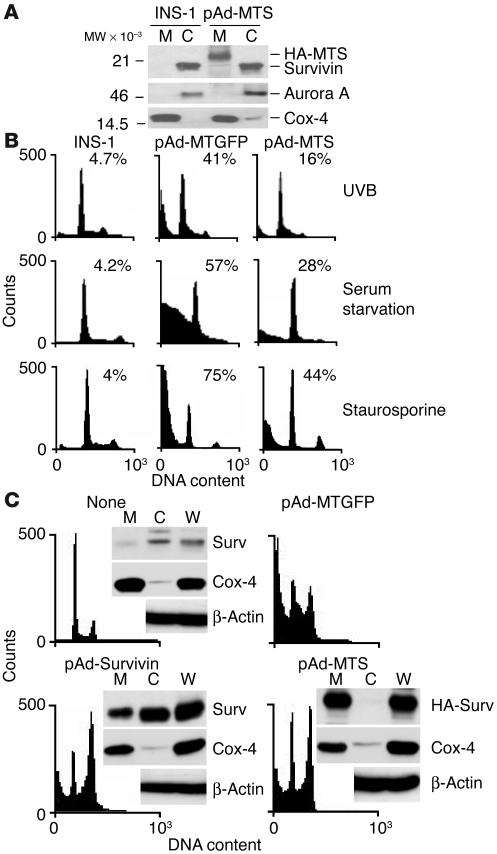
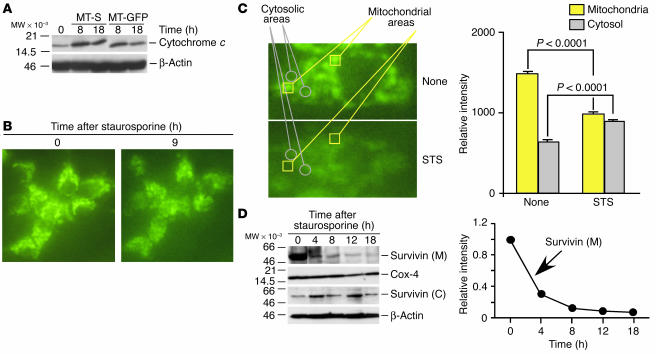
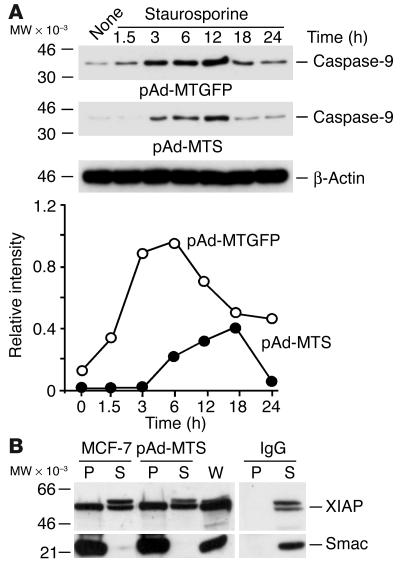
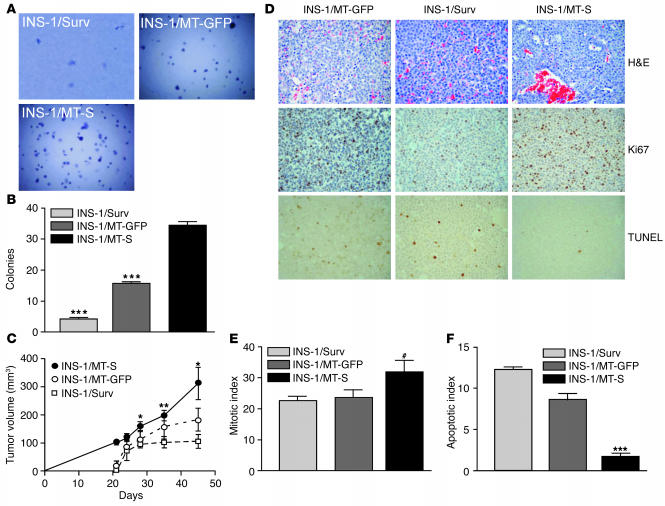
Evasion of apoptosis is a hallmark of cancer, but the molecular circuitries of this process are not understood. Here we show that survivin, a member of the inhibitor of apoptosis gene family that is overexpressed in cancer, exists in a novel mitochondrial pool in tumor cells. In response to cell death stimulation, mitochondrial survivin is rapidly discharged in the cytosol, where it prevents caspase activation and inhibits apoptosis. Selective targeting of survivin to mitochondria enhances colony formation in soft agar, accelerates tumor growth in immunocompromised animals, and abolishes tumor cell apoptosis in vivo. Therefore, mitochondrial survivin orchestrates a novel pathway of apoptosis inhibition, which contributes to tumor progression.


Figures

Figure 1
Figure 1
Mitochondrial localization of survivin. (A) Survivin localization in tumor cell lines. Cytosolic (left panel) or mitochondrial (right panel) extracts from the indicated tumor cell lines were analyzed by immunoblotting. MW, molecular weight. (B) Subcellular fractionation of normal tissues. Mitochondrial (M) or cytosolic (C) fractions extracted from normal testis, spleen, and liver or unfractionated HeLa cell extracts were analyzed by immunoblotting. Cox-4 was used as a mitochondrial marker. (CE) Immunoelectron microscopy. Mitochondrial pellets (C and E) isolated from MCF-7 cells or whole MCF-7 cell extracts (D) were stained with nonimmune IgG (C) or an antibody to survivin (D) followed by colloidal gold-conjugated secondary IgG. Isolated mitochondrial pellets (E) were simultaneously stained with antibodies to survivin (12 nm diameter gold particles) and Smac (6 nm diameter gold particles). Magnification, ×53,000 (C and D), ×104,000 (E).
Figure 2
Figure 2
Topography of mitochondrial survivin. (A) Sensitivity to proteinase K. Mitochondrial or cytosolic fractions were treated with the indicated concentrations of proteinase K and analyzed by immunoblotting. Lower panel: Quantification of Bcl-2 or survivin proteolysis by proteinase K treatment. (B) Permeabilization of mitochondrial membrane. Mitochondrial fractions were treated with the indicated increasing concentrations of digitonin, and pellets (P) or supernatants (S) were analyzed by immunoblotting. mt-Hsp70, mitochondrial Hsp70.
Figure 3
Figure 3
Modulation of mitochondrial survivin during the cellular stress response. (A) Regulation of survivin by hypoxia. HeLa cells were exposed to hypoxia, and analyzed by immunoblotting followed by densitometry. N, normoxic cultures; H, hypoxic cultures. (B) Subcellular fractionation. Cytosolic or mitochondrial fractions from HeLa cells were exposed to hypoxia, and analyzed by immunoblotting. (C) Cycloheximide block. Normoxic or hypoxic HeLa cells were treated with cycloheximide, and analyzed by immunoblotting at the indicated time intervals. Lower panel: β-Actin–normalized densitometric quantification of differential survivin stability in control versus hypoxic conditions. (D) Modulation by DNA damage. Untreated (None) or MCF-7 cells treated with nonapoptotic concentrations of adriamycin (Adriam) were fractionated in cytosolic and mitochondrial fractions, and analyzed by immunoblotting.
Figure 4
Figure 4
Participation of mitochondrial survivin in cell death. (A) Defective mitochondrial import of survivin in INS-1 cells. INS-1 (upper panel) or MCF-7 (lower panel) cells were left untreated (None) or transduced with pAd-Survivin, and isolated mitochondrial or cytosolic fractions were analyzed by immunoblotting. (B) Cytoprotection. INS-1 or MCF-7 cells were transduced with pAd-GFP or pAd-Survivin, treated with staurosporine, and analyzed for hypodiploid DNA content. Data are the mean ± SEM of 3 independent experiments. Inset: Immunoblotting of survivin in transduced INS-1 or MCF-7 cells at the indicated time intervals. (C) Differential sensitivity to apoptosis. INS-1 or MCF-7 cells were treated with suboptimal concentrations of staurosporine (STS) or UVB and analyzed for nuclear morphology of apoptosis by DAPI staining. Data are the mean ± SD of 2 independent experiments. (D) RNAi knock-down. INS-1 or MCF-7 cells were transfected with dsRNA oligonucleotides to survivin (S4) or control (VIII), and analyzed by immunoblotting. (E) Cell cycle analysis. INS-1 or MCF-7 cells transfected with control or survivin dsRNA oligonucleotides were analyzed for cell cycle distribution by flow cytometry. The percentage of cells with hypodiploid (Sub-G1) DNA content is indicated.
Figure 5
Figure 5
Mitochondrial targeting of survivin in INS-1 cells inhibits apoptosis. (A) Cytoprotection in stable transfectants. Parental INS-1 cells or INS-1 cells stably transfected with Surv, MT-GFP, or MT-S were treated with staurosporine and analyzed for caspase-3 and caspase-7 activity (DEVDase activity, green fluorescence) and plasma membrane integrity (propidium iodide, red fluorescence), by multiparametric flow cytometry. The percentage of cells in each quadrant is indicated. (B) Caspase-3 cleavage. INS-1 cells expressing MT-GFP or MT-S were treated with staurosporine and analyzed at the indicated time intervals by immunoblotting. The position of active caspase-3 bands of 17 and 19 kDa is shown. (C) Caspase-9 cleavage. The experimental conditions were as in B except that samples were analyzed for generation of 37-kDa active caspase-9 fragments by immunoblotting. (D) Inhibition of caspase-dependent apoptosis. Parental INS-1 cells or INS-1 cells stably expressing MT-GFP or MT-S were treated with the indicated concentrations of staurosporine in the presence or absence of zVAD-fmk, and scored for nuclear morphology of apoptosis by DAPI staining. Data are the mean ± SEM of 3 independent experiments.
Figure 6
Figure 6
Adenoviral targeting of survivin to mitochondria inhibits apoptosis. (A) Subcellular localization. INS-1 cells were infected with pAd-MTS, and isolated mitochondrial or cytosolic fractions were analyzed by immunoblotting. The position of endogenous or transduced (HA-MTS) survivin is indicated. (B) Cytoprotection by adenoviral transduction. INS-1 cells transduced with pAd-MTGFP or pAd-MTS were treated with UVB, exposed to serum starvation, or treated with staurosporine, and analyzed for DNA content by flow cytometry. Samples labeled as INS-1 were untreated cultures. The percentage of cells with hypodiploid (apoptotic) DNA content is indicated for each condition tested. (C) Mitochondrial survivin is sufficient for cytoprotection. MCF-7 cells were transduced with pAd-MTGFP, pAd-Survivin, or pAd-MTS, treated with staurosporine, and analyzed for hypodiploid DNA content and immunoblotting of whole cell extracts (W), mitochondrial, or cytosolic fractions. The percentages of cells with hypodiploid (apoptotic) DNA content were 47% (nontransduced cultures, data not shown), 40% (pAd-MTGFP), 25% (pAd-Survivin), and 29% (pAd-MTS).
Figure 7
Figure 7
Mitochondrial release of survivin during apoptosis. (A) Effect on cytochrome c release. INS-1 cells stably transfected with MT-GFP or MT-S were treated with staurosporine, harvested at the indicated time intervals, and analyzed by immunoblotting. (B) Fluorescence microscopy. INS-1/MT-S cells were treated with staurosporine and analyzed for cytosolic redistribution of GFP. (C) Single-cell analysis. Areas corresponding to mitochondria (yellow squares) or cytosol (gray circles) were quantitatively analyzed for changes in fluorescence distribution before (None) or after staurosporine treatment (left panel). Right panel: Quantification of single-cell analysis. Changes in fluorescence intensity in individual mitochondrial or cytosolic areas were analyzed in the presence or absence of staurosporine treatment. Data represent an average of 16 individual determinations for mitochondrial areas and 14 individual determinations for cytosolic areas. (D) Time course of mitochondrial release of survivin during cell death. INS-1/MT-S cells were treated with staurosporine, and isolated mitochondrial or cytosolic fractions were analyzed at the indicated time intervals by immunoblotting. Right panel: Densitometric quantification of time-dependent depletion of mitochondrial survivin in response to staurosporine.
Figure 8
Figure 8
Mechanisms of cytoprotection by mitochondrial survivin. (A) Inhibition of caspase-9 processing. MCF-7 cells transduced with pAd-MTGFP or pAd-MTS were treated with staurosporine and analyzed for caspase-9 processing at the indicated time intervals, by immunoblotting. The position of approximately 37-kDa active caspase-9 is indicated. Lower panel: Quantification of caspase-9 generation by densitometry. (B) XIAP-Smac interaction. Control cultures or MCF-7 cells transduced with pAd-MTS were treated with staurosporine and immunoprecipitated with an antibody to Smac or control IgG, and pellets and supernatants were analyzed by immunoblotting with antibodies to XIAP or Smac.
Figure 9
Figure 9
Mitochondrial survivin promotes tumorigenicity. (A) Colony formation in soft agar. Differentially transfected INS-1 cells were plated in semisolid medium and scored for colony formation by phase-contrast microscopy. (B) Quantification of colony formation in soft agar. The experimental conditions were as in A. Data are the mean ± SD of a representative experiment of at least 2 independent determinations. ***P = 0.0001. (C) Kinetics of tumor growth. Stably transfected INS-1 cells were injected subcutaneously in the flank of CB17 SCID/beige mice, and tumor volume was determined at the indicated time intervals. Statistical analysis compared growth of INS-1/Surv versus INS-1/MT-S tumors at day 28 (P = 0.024), day 35 (P = 0.0069), and day 45 (P = 0.015). *P < 0.05; **P < 0.01. (D) Histology. Tissue sections from the indicated INS-1 tumors were stained by H&E, Ki67 reactivity as a measure of cell proliferation, and TUNEL as a measure of apoptosis, in vivo. Magnification, ×400. (E) Mitotic index in vivo. The number of Ki67-positive (proliferating) cells was counted in 7 independent fields, each containing an average of 400 cells. #P = 0.031. (F) Apoptotic index in vivo. The number of TUNEL-positive (apoptotic) cells was counted in 7 independent fields, each containing an average of 400 cells.

References

    1. Hanahan D, Weinberg RA. The hallmarks of cancer. Cell. 2000;100:57–70. - PubMed
    1. Evan GI, Vousden KH. Proliferation, cell cycle and apoptosis in cancer. Nature. 2001;411:342–348. - PubMed
    1. Cory S, Adams JM. The Bcl2 family: regulators of the cellular life-or-death switch. Nat. Rev. Cancer. 2002;2:647–656. - PubMed
    1. Zamzami N, Kroemer G. The mitochondrion in apoptosis: how Pandora’s box opens. Nat. Rev. Mol. Cell Biol. 2001;2:67–71. - PubMed
    1. Martinou JC, Green DR. Breaking the mitochondrial barrier. Nat. Rev. Mol. Cell Biol. 2001;2:63–67. - PubMed

Publication types

MeSH terms