. 2004 Oct 15;64(20):7205-9.
doi: 10.1158/0008-5472.CAN-04-1750.

Gene expression profiling in uveal melanoma reveals two molecular classes and predicts metastatic death

Affiliations

Gene expression profiling in uveal melanoma reveals two molecular classes and predicts metastatic death

Michael D Onken et al. Cancer Res. .

Abstract

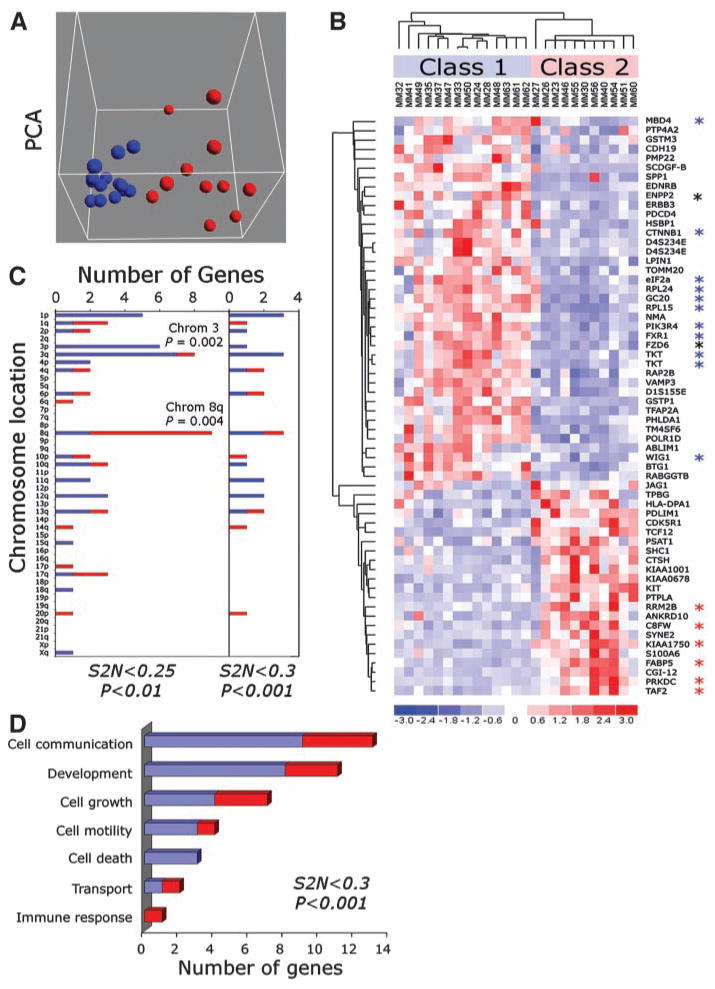
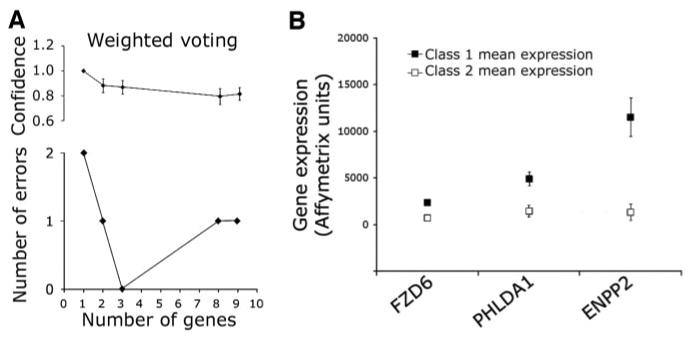
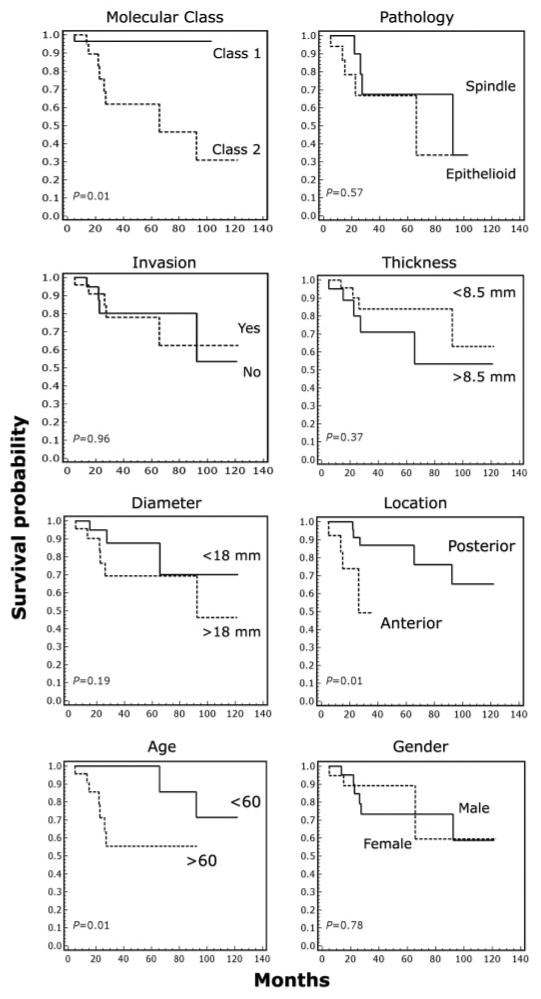
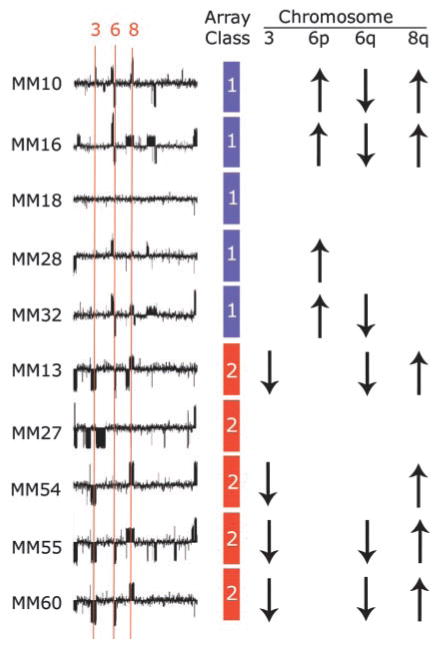
Melanomas are notoriously difficult to classify because of a lack of discrete clinical and pathological stages. Here, we show that primary uveal melanomas surprisingly cluster into two distinct molecular classes based on gene expression profile. Genes that discriminate class 1 (low-grade) from class 2 (high-grade) include highly significant clusters of down-regulated genes on chromosome 3 and up-regulated genes on chromosome 8q, which is consistent with previous cytogenetic studies. A three-gene signature allows biopsy-size tumor samples to be assigned accurately to tumor classes using either array or PCR platforms. Most importantly, this molecular classification strongly predicts metastatic death and outperforms other clinical and pathological prognostic indicators. These studies offer new insights into melanoma pathogenesis, and they provide a practical foundation for effective clinical predictive testing.


Figures

Fig. 1
Fig. 1
Gene expression profile analysis of primary uveal melanomas reveals two distinct tumor classes. A, principal component analysis (PCA) demonstrating a tight cluster of 14 tumors (blue spheres; class 1) and a distinct cluster of 11 tumors (red spheres; class 2). B, hierarchical clustering heat map of 62 discriminating genes with an absolute signal-to-noise (S2N) score ≥ 0.25 and P < 0.01. Class 1 (low-grade) and class 2 (high-grade) tumors are indicated. Blue asterisks indicate chromosome 3 genes that are down-regulated in class 2, red asterisks indicate chromosome 8q genes that are up-regulated in class 2, and black asterisks indicate chromosome 8q genes that are down-regulated in class 2. C, chromosomal distribution of the top 62 (left panel) and top 26 (right panel) discriminating genes with screening criteria indicated below each panel. The short arm (p) and long arm (q) are indicated for each chromosome. D, Gene Ontology functional groups for the top 26 genes. For C and D, blue bars indicate genes that are down-regulated, and red bars indicate genes that are up-regulated in class 2 tumors.
Fig. 2
Fig. 2
Supervised training models identify a three-gene signature that accurately predicts tumor class. A, correct assignments and confidence scores (with SE) using a weighted voting algorithm. The performance of the model is indicated as a function of the number of genes included in the model. As few as three genes assign all tumors to the correct class with no improvement in performance by including additional genes. B, comparison of mean Affymetrix gene expression values in class 1 versus class 2 tumors for the 3 signature genes (error bars indicate SE).
Fig. 3
Fig. 3
The gene expression signature accurately predicts metastatic death. Kaplan-Meier survival analysis in 50 uveal melanoma patients. Molecular class indicates class label using the gene expression signature. Pathology indicates the predominant tumor cell type indicated on the official pathology report. Other clinical features are indicated. All deaths were due to melanoma metastasis. Statistical significance is indicated for each parameter.
Fig. 4
Fig. 4
Comparison of molecular classification and microarray-based comparative genomic hybridization in 10 primary uveal melanomas. Diagrams depict genome-wide comparative genomic hybridization analysis of a chromosomes (in numerical order from left to right, except the X chromosome), with the locations of chromosomes 3, 6, and 8 indicated. Deviations above and below the midline indicate increased and decreased DNA copy number, respectively. The molecular tumor class based on gene expression array is indicated by a blue or red box (class 1 or class 2, respectively). A summary of DNA copy number changes detected by comparative genomic hybridization is indicated by up or down arrows for chromosomes 3, 6p, 6q, and 8q. Absence of an arrow indicates no significant change from normal DNA copy number.

References

    1. Weyers W, Euler M, Diaz-Cascajo C, Schill WB, Bonczkowitz M. Classification of cutaneous malignant melanoma: a reassessment of histopathologic criteria for the distinction of different types. Cancer (Phila) 1999;86:288–99. - PubMed
    1. Seddon JM, Albert DM, Lavin PT, Robinson N. A prognostic factor study of disease-free interval and survival following enucleation for uveal melanoma. Arch Ophthalmol. 1983;101:1894–9. - PubMed
    1. Sisley K, Rennie IG, Parsons MA, et al. Abnormalities of chromosomes 3 and 8 in posterior uveal melanoma correlate with prognosis. Genes Chromosomes Cancer. 1997;19:22–8. - PubMed
    1. Prescher G, Bornfeld N, Friedrichs W, Seeber S, Becher R. Cytogenetics of twelve cases of uveal melanoma and patterns of nonrandom anomalies and isochromosome formation. Cancer Genet Cytogenet. 1995;80:40–6. - PubMed
    1. Loercher AE, Harbour JW. Molecular genetics of uveal melanoma. Curr Eye Res. 2003;27:69–74. - PubMed

Publication types