. 2004 Sep;5(3):238-52.
doi: 10.1007/s10162-004-4027-4. Epub 2004 Jun 17.

Cross correlation by neurons of the medial superior olive: a reexamination

Affiliations

Cross correlation by neurons of the medial superior olive: a reexamination

Ranjan Batra et al. J Assoc Res Otolaryngol. 2004 Sep.

Abstract

Initial analysis of interaural temporal disparities (ITDs), a cue for sound localization, occurs in the superior olivary complex. The medial superior olive (MSO) receives excitatory input from the left and right cochlear nuclei. Its neurons are believed to be coincidence detectors, discharging when input arrives simultaneously from the two sides. Many current psychophysical models assume a strict version of coincidence, in which neurons of the MSO cross correlate their left and right inputs. However, there have been few tests of this assumption. Here we examine data derived from two earlier studies of the MSO and compare the responses to the output of a computational model. We find that the MSO is not an ideal cross correlator. Ideal cross correlation implies a strict relationship between the precision of phase-locking of the inputs and the range of ITDs to which a neuron responds. This relationship does not appear to be met. Instead, the modeling implies that a neuron responds over a wider range of ITDs than expected from the inferred precision of phase-locking of the inputs. The responses are more consistent with a scheme in which the neuron can also be activated by the input from one side alone. Such activation degrades the tuning of neurons in the MSO to ITDs.


Figures
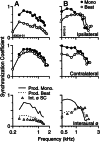
Figure 1
Figure 1
A,B. Synchrony of two neurons to monaural tones and binaural-beat stimuli as a function of frequency. Both neurons were recorded from the medial superior olive (MSO) of cats by Yin and Chan (1990). Top and middle panels: synchronization coefficients (SCs) to ipsilateral and contralateral tones, respectively, when delivered monaurally (filled circles) or as part of binaural-beat stimuli (unfilled circles). SCs were obtained by Fourier analysis of the responses. Bottom panels: interaural-phase SCs measured in response to binaural-beat stimuli (triangles) and predictions obtained by multiplying ipsilateral and contralateral SCs derived from responses to monaurally presented tones (solid line) and from responses to binaural beat stimuli (dashed line).
Figure 2
Figure 2
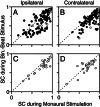
Comparison of ipsilateral and contralateral SCs derived from responses to binaural-beat stimuli with those derived from responses to monaural stimuli. A,B. Comparisons for neurons in the MSO of the cat. Each point represents responses measured at a particular combination of frequency and intensity. Open circles: response from each neuron at lowest frequency and highest intensity at which comparison was available. C,D. Comparisons for peak-type neurons in the superior olivary complex of the rabbit. Each point represents the response of a different neuron at its best frequency. Dashed lines: equality. A,B: 108 and 127 responses from 10 and 12 neurons, respectively; C,D: 22 and 23 neurons, respectively.
Figure 3
Figure 3
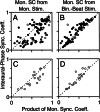
Comparison of the measured interaural-phase SCs with predictions obtained by multiplying ipsilateral and contralateral SCs. Same format as Figure 2. Only responses to matching monaural and binaural-beat stimuli are plotted. Correlation coefficients for full data from cat and for data at lowest frequencies were (A) 0.68, 0.42; (B) 0.85, 0.72. Correlation coefficients for rabbit were (C) 0.84; (D) 0.91. A,B: 97 responses from 10 neurons; C,D: 18 neurons.
Figure 4
Figure 4
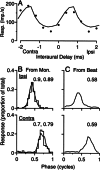
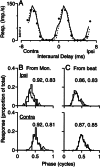
Modeling of neuron in MSO studied by Goldberg and Brown (1969). A. Comparison of delay curve produced by model (line) with measured response of neuron (circles). B,C. Monaural cycle histograms derived from responses to monaural tones and from binaural-beat stimuli, respectively. Histogram: response of neuron. Smooth lines: response of model. Numbers in left panels: SCs of neuron and model, respectively. Numbers in right panels: SCs of the model. Parameters of model are as given in Table 1.
Figure 5
Figure 5
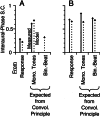
Modeling of interaural-phase SCs. A. Neuron studied by Goldberg and Brown (1969). B. Neuron studied by Yin and Chan (1990). Solid arrows: interaural-phase SCs measured from, or based on applying the convolution principle to, neural data. Dashed arrows: interaural-phase SCs that arise from the model. Leftmost column in each panel: interaural-phase SC of the response. Interaural-phase SC of the neuron was calculated from the response to static delays, that of the model from the response to a binaural-beat stimulus. Center and right columns: expected values of the interaural-phase SC obtained by multiplying the ipsilateral and contralateral SCs derived from responses to monaural tones and from responses to binaural-beat stimuli. Parameters as given in Tables 1 and 2.
Figure 6
Figure 6
Modeling of neuron in MSO studied by Yin and Chan (1990). Format similar to that of Figure 4. Dashed line in A: Delay curve derived from response of neuron to binaural-beat stimulus. Parameters of model are as given in Table 2.
Figure 7
Figure 7
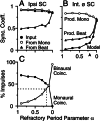
Effect on the model of changing the refractory period parameter α, parameter α is plotted on a reversed axis because the strength of the refractory period varies inversely α. A. Effect on the ipsilateral SC. Filled circles: SCs of the input fiber; open circles and triangles: SCs derived from responses to monaural and binaural-beat stimulation, respectively. B. Effect on the interaural-phase SC. Filled circles: interaural-phase SC of model neuron; open circles and triangles: expected interaural-phase SCs based on monaural SCs derived from responses to monaural and binaural-beat stimulation, respectively. Arrowhead: apparent maximum value of α in neurons studied in cat and rabbit as derived from panel C. C. Effect on source of action potentials in model neuron. Filled circles: monaural coincidences; open circles: binaural coincidences. Dashed lines: lowest apparent proportion of binaural coincidences in cat and rabbit and associated value of α. Values of unvaried parameters in simulation are given in Table 2.
Figure 8
Figure 8
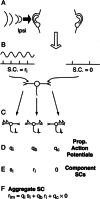
Analysis of SC in response to monaural stimulation. A. Monaural stimulation. B. Inputs to binaural neuron. Activity of ipsilateral input is synchronized to tone with SC as indicated. Spontaneous activity is present at contralateral input and is not synchronized to the tone. C. Action potentials of the binaural neuron divided into those elicited by ipsilateral monaural coincidences, binaural coincidences, and contralateral monaural coincidences. D. Proportions of action potentials elicited in the three different ways. E. SCs for each group of action potentials. F. The aggregate SC is a linear combination of the SCs of the three components.
Figure 9
Figure 9
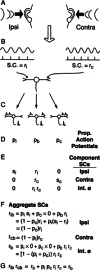
Analysis of the SCs in response to a binaural-beat stimulus. A. Binaural stimulation. B. Inputs to binaural neuron. Activity of each input is synchronized to the tone at the corresponding ear with SC as indicated. C. Action potentials of the binaural neuron divided into those elicited by ipsilateral monaural coincidences, binaural coincidences, and contralateral monaural coincidences. D. Proportions of action potentials elicited in the three different ways. E. Ipsilateral, contralateral, and interaural-phase SCs for each group of action potentials. F. Equations for aggregate ipsilateral, aggregate contralateral, and aggregate interaural-phase SCs. G. The product of the aggregate SCs to tones derived from the binaural-beat stimulus is approximately equal to the interaural-phase SC.

Similar articles

Cited by

References

    1. Adams JC, Mugnaini E. Immunocytochemical evidence for inhibitory and disinhibitory circuits in the superior olive. Hear. Res. 1990;49:281–298. doi: 10.1016/0378-5955(90)90109-3. - DOI - PubMed
    1. Agmon–Snir H, Carr CE, Rinzel J. The role of dendrites in auditory coincidence detection. Nature. 1998;393:268–208. doi: 10.1038/30505. - DOI - PubMed
    1. Banks MI, Smith PH. Intracellular recordings from neurobiotin-labeled cells in brain slices of the rat medial nucleus of the trapezoid body. J. Neurosci. 1992;12:2819–2837. - PMC - PubMed
    1. Batra R, Fitzpatrick DC. Processing of interaural temporal disparities in the medial division of the ventral nucleus of the lateral lemniscus. J. Neurophysiol. 2002;88:666–675. - PubMed
    1. Batra R, Kuwada S, Fitzpatrick DC. Sensitivity to interaural temporal disparities of low- and high-frequency neurons in the superior olivary complex: I. Heterogeneity of responses. J. Neurophysiol. 1997a;78:1222–1236. - PubMed

Publication types

LinkOut - more resources