. 2004 Sep;5(3):305-22.
doi: 10.1007/s10162-004-4026-5. Epub 2004 Aug 12.

Topographic spread of inferior colliculus activation in response to acoustic and intracochlear electric stimulation

Affiliations

Topographic spread of inferior colliculus activation in response to acoustic and intracochlear electric stimulation

Russell L Snyder et al. J Assoc Res Otolaryngol. 2004 Sep.

Abstract

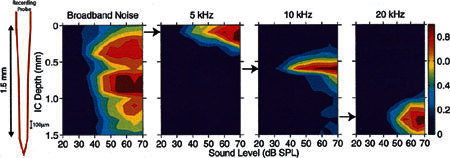
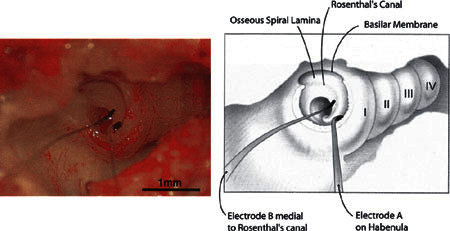
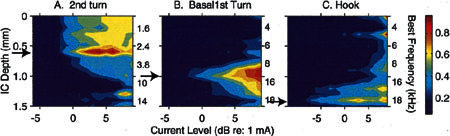
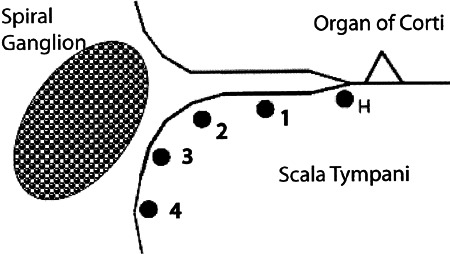
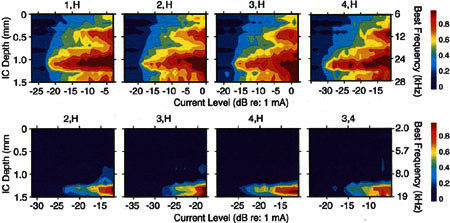
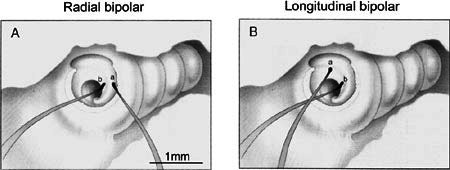
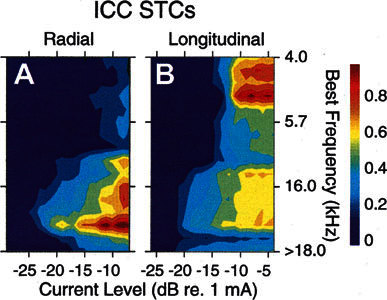
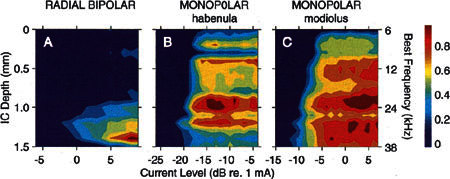
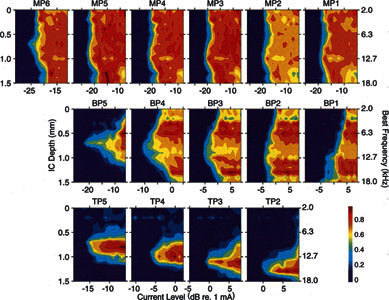
The design of contemporary multichannel cochlear implants is predicated on the presumption that they activate multiple independent sectors of the auditory nerve array. The independence of these channels, however, is limited by the spread of activation from each intracochlear electrode across the auditory nerve array. In this study, we evaluated factors that influence intracochlear spread of activation using two types of intracochlear electrodes: (1) a clinical-type device consisting of a linear series of ring contacts positioned along a silicon elastomer carrier, and (2) a pair of visually placed (VP) ball electrodes that could be positioned independently relative to particular intracochlear structures, e.g., the spiral ganglion. Activation spread was estimated by recording multineuronal evoked activity along the cochleotopic axis of the central nucleus of the inferior colliculus (ICC). This activity was recorded using silicon-based single-shank, 16-site recording probes, which were fixed within the ICC at a depth defined by responses to acoustic tones. After deafening, electric stimuli consisting of single biphasic electric pulses were presented with each electrode type in various stimulation configurations (monopolar, bipolar, tripolar) and/or various electrode orientations (radial, off-radial, longitudinal). The results indicate that monopolar (MP) stimulation with either electrode type produced widepread excitation across the ICC. Bipolar (BP) stimulation with banded pairs of electrodes oriented longitudinally produced activation that was somewhat less broad than MP stimulation, and tripolar (TP) stimulation produced activation that was more restricted than MP or BP stimulation. Bipolar stimulation with radially oriented pairs of VP ball electrodes produced the most restricted activation. The activity patterns evoked by radial VP balls were comparable to those produced by pure tones in normal-hearing animals. Variations in distance between radially oriented VP balls had little effect on activation spread, although increases in interelectrode spacing tended to reduce thresholds. Bipolar stimulation with longitudinally oriented VP electrodes produced broad activation that tended to broaden as the separation between electrodes increased.


Figures

Figure 1
Figure 1
Acoustic STC width calculation.
Figure 2
Figure 2
Neural waveforms from GP26 illustrating activity evoked by an electrical pulse presented at time = 0. Upper two rows show recordings from a recording site 0.8 mm (site 9) from the most superficial site. Lower two rows show recordings from a recording site 1.1 mm (site 12) from the most superficial site. The trial from which the data were obtained is indicated at the top right of each panel. The top panel of each pair of panels was obtained early within an experiment while the lower of each pair of panels was obtained several hours later in the same experiment. The example shown in the top two panels shows an isolated single unit while the lower example shows a multineuronal cluster. In most cases, multineuronal clusters were observed. Circles indicate spikes accepted by the spike-sorting software.
Figure 3
Figure 3
Acoustic frequency response areas recorded with a 16-channel probe in the ICC of a guinea pig. Each of the 16 panels represents measurements from one probe site. In each panel, the abscissa is frequency (3–32 kHz) and ordinate is stimulus intensity (in dB SPL). The normalized response rates are represented in pseudocolor with dark blue equal to spontaneous activity and dark red equal to maximum driven response. Response areas from sites distributed sequentially along the probe from most superficial to deepest are distributed from left to right and from top to bottom. GP24.
Figure 4
Figure 4
Frequency gradients recorded from 9 multichannel recording probes in 9 animals identified by the key.
Figure 5
Figure 5
Spatial tuning curves (STCs) evoked by broadband noise and tone bursts at 5, 10, and 20 kHz. In each STC, the vertical dimension is ICC depth (i.e., distance along the recording probe) and the horizontal dimension shows stimulus intensity. The colors represent normalized spike rates indicated by the pseudocolor scale shown at the right. In the noise STC, activity was broadly distributed even at low stimulus levels. In each tone-evoked STC, activity was spatially restricted at near-threshold levels and spread across the cochleotopic axis as tone intensity increased, In most cases, the region of lowest threshold corresponded to the response focus, i.e., region of maximum response. The response focus shifted ventrally as the stimulus frequency increased. GP16.
Figure 6
Figure 6
Photographic image (left) and drawing (right) of two visually placed, radial bipolar electrodes. The lateral wall of the bulla and cochlear basal turn has been removed so that the osseous spiral lamina can be seen in the hook and initial basal turn regions of the cochlea. The four turns of the guinea pig cochlea are indicated by the Roman numerals I–IV. GP23.
Figure 7
Figure 7
Spatial tuning curves (STCs) illustrating the spatial distribution of activity evoked by electrical pulses delivered via visually placed (VP) electrodes at three locations within the cochlear spiral. A. VP electrodes in the second turn. GP13. B. VP electrodes in the basal first turn. GP15. C. VP electrodes in the hook region. GP15. Responses were normalized relative oval/round window stimulation. The response focus for each STC is indicated by the black arrows. All stimuli were single biphasic pulses 40 μs/phase.
Figure 8
Figure 8
Diagram of five radial electrode placements used with VP radial electrodes to test the effects of different radial electrode placements in the basal cochlea on threshold and spatial spread of evoked activity in the ICC.
Figure 9
Figure 9
Upper row: Spatial tuning curves (STCs) obtained using a pair of radial bipolar VP electrodes, one over the habenula perforata (H) and the other at locations successively further from it (see placements 1, 2, 3, or 4 in Fig. 8). GP29. Lower row: STCs evoked by the electrode positions indicated above each panel (see Fig. 8). The VP electrodes in the far right column were positioned at sites 3 and 4, straddling the spiral ganglion. GP23.
Figure 10
Figure 10
Drawings of VP electrodes in the cochlea of a guinea pig. A. Visually placed ball electrode pair oriented radially at H and 3 on the osseous spiral lamina. B. VP electrodes placed longitudinally spanning the boundary of the hook and first turn. Electrode is placed on the osseous spiral lamina over or just distal to Rosenthal’s canal and the spiral ganglion (location 3, Fig. 8). GP23.
Figure 11
Figure 11
A,B. STCs evoked by the same electrodes seen in Figure 10. GP23.
Figure 12
Figure 12
Spatial tuning curves (STC) evoked by pulses delivered to the basal turn of guinea pig GP15. A. STC evoked by stimulation with bipolar radial VP electrodes. B. STC evoked by monopolar stimulation with pulses delivered via the habenular electrode of the VP pair used in A. C. STC evoked by monopolar stimulation with pulses delivered via the modiolar electrode used in A.
Figure 13
Figure 13
Spatial tuning curves (STCs) evoked by activation of a banded electrode. Activation of all bands across the entire recording array at current levels at least 1–2 dB below to at least 2 dB above threshold are illustrated. Upper row: Each band activated as a monopole (MP) electrode. MP6 is the most apical band; MP1 is the most basal band. Middle row: Each adjacent pair of bands activated as bipoles, BP. BP1 = activation of bands 1 and 2; BP5 = activation of bands 5 and 6, etc. Bottom row: Adjacent triads of electrodes activated as tripoles, center band acting as active and adjacent bands acting as return electrodes. TP2 = activation of bands 1, 2, and 3; TP5 = activation of bands 4, 5, and 6. Stimuli were biphasic pulses 160 μs/phase. GP25.

References

    1. Bierer JA, Middlebrooks JC. Auditory cortical images of cochlear-implant stimuli: Dependence on electrode configuration. J. Neurophysiol. 2002;87:478–492. - PubMed
    1. Black RC, Clark GM. Differential electrical excitation of the auditory nerve. J. Acoust. Soc. Am. 1980;67:868–874. - PubMed
    1. Black RC, Clark GM, Patrick JF. Current distribution measurements with the human cochlea. IEEE Trans. Biomed. Eng. 1981;BME-28:721–725. - PubMed
    1. Black RC, Clark GM, Tong YC, Patrick JF. Current distribution in cochlear stimulation. Ann. N.Y. Acad. Sci. 1983;405:137–145. - PubMed
    1. Briaire JJ, Frijns JHM. Field patterns in 3D tapered spiral model of the electrically stimulated cochlea. Hear. Res. 2000;148:18–30. doi: 10.1016/S0378-5955(00)00104-0. - DOI - PubMed

Publication types