. 2004 Nov;16(11):3148-67.
doi: 10.1105/tpc.104.026476. Epub 2004 Oct 19.

Plant proteins that interact with VirB2, the Agrobacterium tumefaciens pilin protein, mediate plant transformation

Affiliations

Plant proteins that interact with VirB2, the Agrobacterium tumefaciens pilin protein, mediate plant transformation

Hau-Hsuan Hwang et al. Plant Cell. 2004 Nov.

Abstract

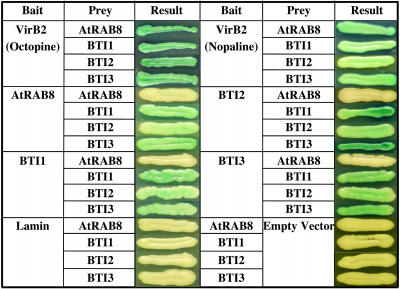
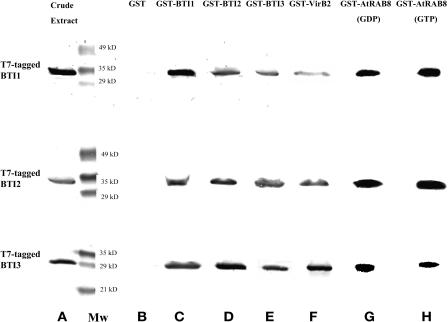
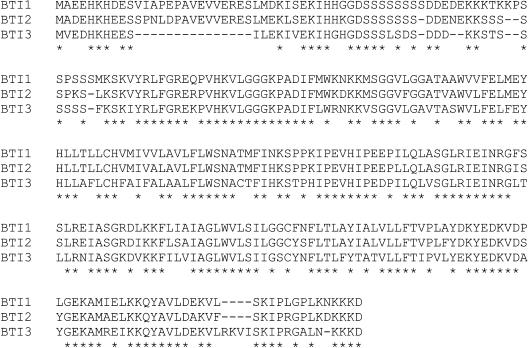
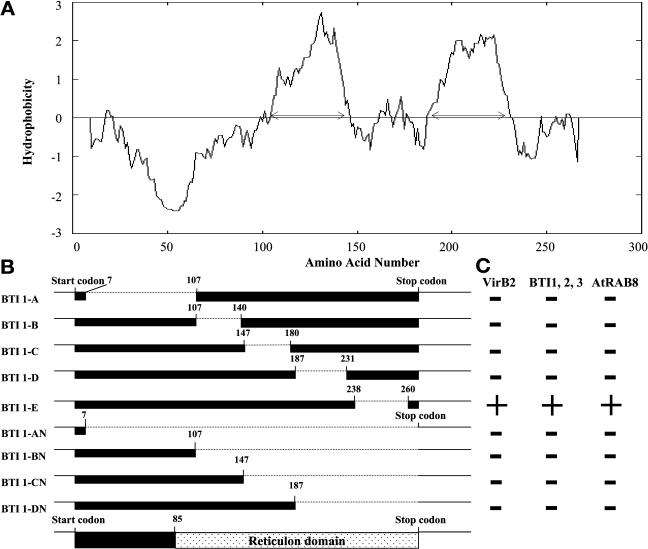
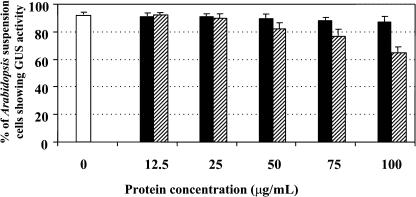
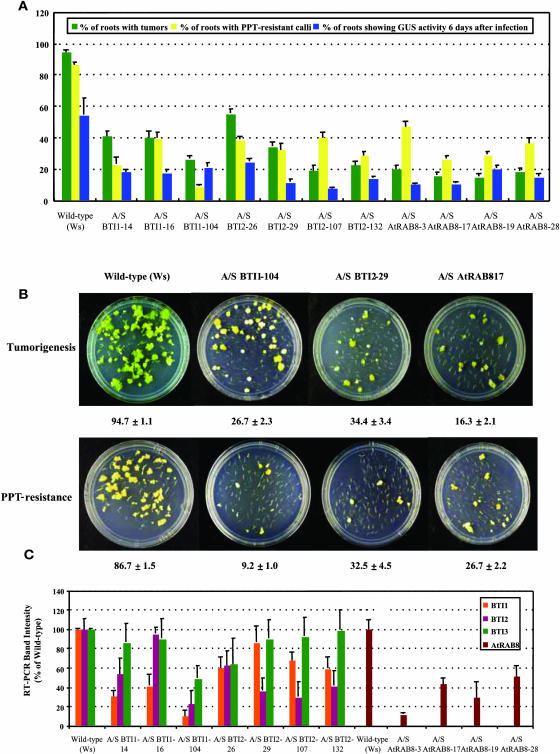
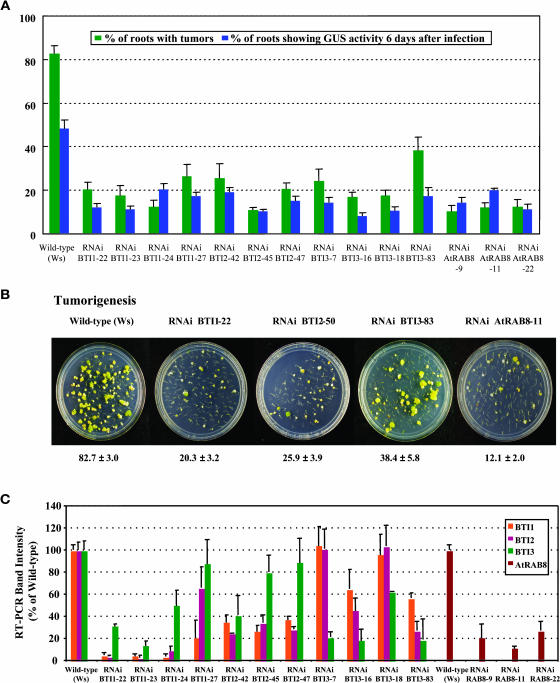
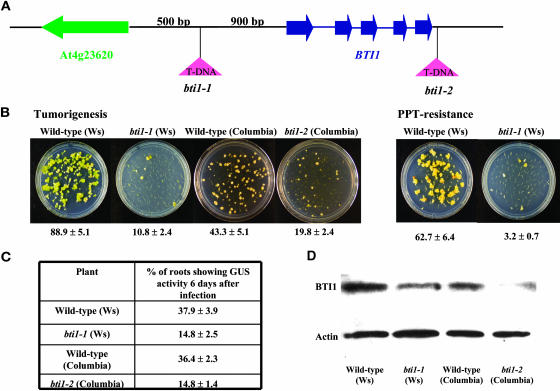
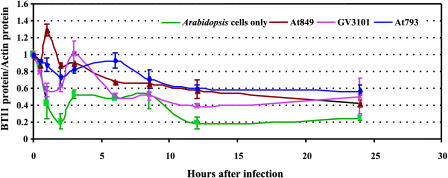
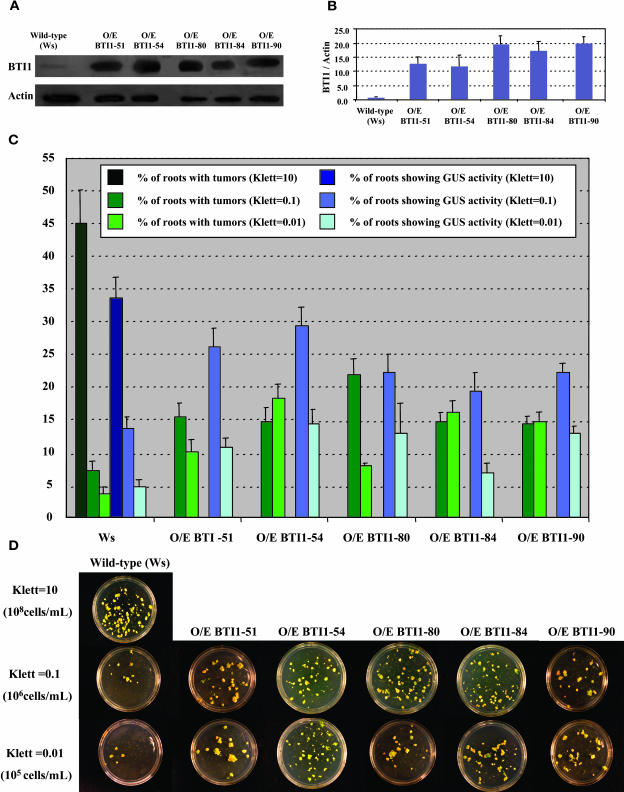
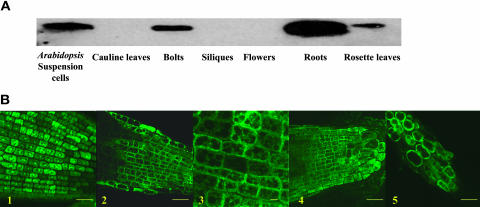
Agrobacterium tumefaciens uses a type IV secretion system (T4SS) to transfer T-DNA and virulence proteins to plants. The T4SS is composed of two major structural components: the T-pilus and a membrane-associated complex that is responsible for translocating substrates across both bacterial membranes. VirB2 protein is the major component of the T-pilus. We used the C-terminal-processed portion of VirB2 protein as a bait to screen an Arabidopsis thaliana cDNA library for proteins that interact with VirB2 in yeast. We identified three related plant proteins, VirB2-interacting protein (BTI) 1 (BTI1), BTI2, and BTI3 with unknown functions, and a membrane-associated GTPase, AtRAB8. The three BTI proteins also interacted with VirB2 in vitro. Preincubation of Agrobacterium with GST-BTI1 protein decreased the transformation efficiency of Arabidopsis suspension cells by Agrobacterium. Transgenic BTI and AtRAB8 antisense and RNA interference Arabidopsis plants are less susceptible to transformation by Agrobacterium than are wild-type plants. The level of BTI1 protein is transiently increased immediately after Agrobacterium infection. In addition, overexpression of BTI1 protein in transgenic Arabidopsis results in plants that are hypersusceptible to Agrobacterium-mediated transformation. Confocal microscopic data indicate that GFP-BTI proteins preferentially localize to the periphery of root cells in transgenic Arabidopsis plants, suggesting that BTI proteins may contact the Agrobacterium T-pilus. We propose that the three BTI proteins and AtRAB8 are involved in the initial interaction of Agrobacterium with plant cells.


Figures

Figure 1.
Figure 1.
AtRAB8 and the Three BTI Proteins Interact with Processed VirB2 in Yeast. Virulence proteins were tested for interaction with BTI proteins or AtRAB8 using a two-hybrid system as described in Methods. In addition, the three BTI proteins were tested for interaction with themselves, each other, and AtRAB8. Note that AtRAB8 interacts with the BTI proteins when used as a bait, but not when used as a prey protein. AtRAB8 does not show interaction with itself.
Figure 2.
Figure 2.
GST-VirB2, the Three BTI Proteins, and AtRAB8 Interact with Each Other in Vitro. Crude lysates of E. coli that contained either GST-VirB2, GST tags on the various BTI proteins, or GST-AtRAB8 were incubated with glutathione-sepharose beads, washed with binding buffer, then incubated with T7-tagged versions of BTI1, BTI2, or BTI3. After washing the beads, the bound proteins were eluted with glutathione, separated by SDS-PAGE, and protein gel blot analysis performed using anti-T7 tag antibodies. (Lane A) Crude extracts from E. coli individually expressing the T7-tagged BTI proteins analyzed using T7-tag antibodies; (Lane B) the three T7-tagged BTI proteins individually incubated with GST; (Lanes C, D, and E) the three BTI proteins individually incubated with themselves and with each other; (Lane F) GST-VirB2 protein individually incubated with the three BTI proteins; (Lane G) GST-AtRAB8 (supplemented with GDP) protein individually incubated with the three BTI proteins; (Lane H) GST-AtRAB8 (supplemented with GTP) protein individually incubated with the three BTI proteins. Mw, molecular weight markers.
Figure 3.
Figure 3.
Protein Sequence Alignment of the Three BTI Proteins Based on the ClustalW Program (Thompson et al., 1994). The asterisks indicate identical amino acid residues. The three BTI proteins share 56% amino acid similarity.
Figure 4.
Figure 4.
Mapping BTI Protein Domains Necessary for Interaction with VirB2, BTI, and AtRAB8 in Yeast. (A) Hydropathy profile of BTI1 protein using the Prediction of Transmembrane Regions and Orientation program (Hofmann and Stoffel, 1993). The C-terminal region of BTI1 protein contains two hydrophobic domains. The N-terminal region of BTI1 has one hydrophilic domain and is variable among the three BTI proteins. The arrows indicate the putative membrane domains of BTI1 protein. (B) Schematic diagram of the various BTI1 protein-deletion mutants. The dotted lines indicate the deleted region of each mutant protein. (C) Results of protein-interaction experiments in yeast. Only mutant protein BTI1-E interacts with VirB2, BTI1, BTI2, BTI3, and AtRAB8. Construction of the mutant bti1 genes and the yeast interaction assays are described in Materials and Methods.
Figure 5.
Figure 5.
Preincubation of Agrobacterium with GST-BTI1 Inhibits Arabidopsis Suspension Cell Transformation. Agrobacterium At849 induced with acetosyringone was used to infect Arabidopsis suspension cells either without pretreatment (open), with bacteria pretreated with GST (solid), or GST-BTI1 (striped) before plant infection. The numbers represent the percentage of Arabidopsis suspension cells that stained blue with X-Gluc. The data are presented as the average of three experiments. Error bars = se.
Figure 6.
Figure 6.
Transgenic BTI and AtRAB8 Antisense Plants Are Less Susceptible to Agrobacterium-Mediated Root Transformation Than Are Wild-Type Plants. (A) T2 generation transgenic BTI1, BTI2, and AtRAB8 antisense plants show lower stable and transient transformation efficiencies than do wild-type plants. Green bars represent the percentage of root segments forming tumors 4 weeks after infection with the tumorigenic strain Agrobacterium A208. Yellow bars represent the percentage of root segments forming phosphinothricin-resistance calli 4 weeks after infection with Agrobacterium At872. Blue bars represent the percentage of root segments showing GUS activity 6 d after infection with Agrobacterium At849. At least 20 independent plants were tested for each transgenic line and >80 root segments were examined for each plant. Error bars = se. (B) Representative plates of BTI1, BTI2, and AtRAB8 A/S transgenic root segments showing reduced frequency of tumor formation and ppt-resistance. The numbers below each plate indicate the average stable transformation efficiency of each line ±se. (C) Transgenic BTI1 and BTI2 antisense plants show reduced levels of BTI transcripts. Transgenic AtRAB8 antisense (A/S) plants show reduced levels of AtRAB8 transcripts. Transcript levels of each BTI gene and AtRAB8 in A/S transgenic plants are shown as a relative percentage of that of wild-type plants. Data are shown as average values of two RT-PCR reactions from three T2 generation plants of each line. Note that antisense BTI1 and BTI2 plants show a reduced level of BTI2 and BTI1 transcripts, respectively, as well as reduced levels of transcripts targeted by the specific antisense construction. Note also that antisense BTI1 and BTI2 plants generally show a lesser reduction in BTI3 transcripts. Error bars = se.
Figure 7.
Figure 7.
Transgenic BTI and AtRAB8 RNAi Plants Show Reduced Susceptibility to Agrobacterium-Mediated Root Transformation. (A) T2 generation BTI1, BTI2, BTI3, and AtRAB8 RNAi transgenic plants show lower stable and transient transformation efficiencies compared with wild-type plants. Green bars represent the stable transformation efficiency. The root segments were infected with the tumorigenic strain Agrobacterium A208. Blue bars represent the percentage of root segments showing GUS activity 6 d after infection with Agrobacterium At849. At least 20 independent plants were tested for each transgenic line and >80 root segments were examined for each plant. Error bars = se. (B) Representative plates of transgenic BTI and AtRAB8 RNAi plants showing resistance to tumor formation. The numbers below each plate indicate the average stable transformation efficiency ±se. (C) Transgenic BTI RNAi plants show reduced levels of BTI transcripts. Transgenic AtRAB8 RNAi plants show reduced levels of AtRAB8 transcripts. Transcript levels of each BTI gene and AtRAB8 in RNAi transgenic plants are shown as a relative percentage of that of wild-type plants. Data are shown as average values of two RT-PCR reactions from three T2 generation plants of each line. Note that RNAi BTI1, BTI2, and BTI3 plants preferentially show a reduced level of transcripts targeted by the specific construction, whereas other BTI transcripts are reduced to a lesser extent. Error bars = se.
Figure 8.
Figure 8.
Arabidopsis Plants with T-DNA Insertions in BTI1 Show Reduced Levels of Agrobacterium-Mediated Root Transformation. (A) Schematic representation of the region around the Arabidopsis BTI1 gene. In bti1-1 mutant plants, the T-DNA is inserted 900 bp before the start codon of the BTI1 gene. In bti1-2 mutant plants, the T-DNA is inserted 117 bp downstream of the BTI1 stop codon. (B) bti1-1 and bti1-2 mutant plants are resistant to stable Agrobacterium-mediated root transformation. Representative plates of roots infected with Agrobacterium A208 (for tumorigenesis assays) and Agrobacterium At872 (for ppt-resistance assays) are shown. The numbers below each plate indicate average values of results from 20 individual plants ±se. (C) bti1-1 and bti1-2 mutant plants show reduced susceptibility to transient transformation. Data are indicated as average values of results from 20 individual plants infected with Agrobacterium At849, ±se. (D) bti1-1 and bti1-2 T-DNA–insertion mutant plants show reduced levels of BTI1 protein compared with wild-type plants. Proteins were extracted from roots and subjected to protein gel blot analysis as described in Methods. The amount of actin protein was used to show equivalent loading of each lane.
Figure 9.
Figure 9.
BTI1 Protein Levels Transiently Increase after Agrobacterium Infection of Arabidopsis Suspension Cells. Plant cells were infected with various Agrobacterium strains (or were mock-inoculated), proteins were extracted at various times, and the proteins were subjected to protein gel blot analysis using anti-BTI1 antibody. The amount of BTI1 protein in each sample was normalized to the amount of actin, as determined by protein gel blot analysis using antiactin antibody. The ratio of BTI1 protein:actin protein was normalized to 1 at 0 h. The green line indicates BTI1 protein levels of uninfected Arabidopsis suspension cell cultures. The red line indicates BTI1 protein levels of Arabidopsis suspension cells infected with Agrobacterium At849 (GV3101 containing pBISN1; this strain can transfer both T-DNA and virulence proteins). The purple line shows BTI1 protein levels of Arabidopsis suspension cells infected with Agrobacterium GV3101 (nononcogenic Agrobacterium strain containing a disarmed pTiC58 plasmid; this strain can transfer virulence proteins but not T-DNA). The blue line indicates BTI1 protein levels of Arabidopsis suspension cells infected with Agrobacterium At793 (pBISN1 in Agrobacterium A136 lacking a Ti-plasmid; this strain can transfer neither virulence proteins nor T-DNA). Data shown in the figure are average values of three independent experiments. Error bars = se.
Figure 10.
Figure 10.
Transgenic BTI1 Overexpressing Plants Show an Increased Frequency of Agrobacterium-Mediated Root Transformation. (A) BTI1 protein levels of transgenic BTI1 overexpressing plants were monitored by protein gel blot analysis using BTI1 antibodies. (B) BTI1 protein levels in each sample shown in (A) were normalized to the amount of actin in the sample. The ratio of BTI1 protein:actin protein was normalized to 1 in the wild-type plant. Data are shown as average values of three protein gel blot analyses from three T2 generation plants of each line. Error bars = se. (C) T2 Generation transgenic BTI1 overexpressing (O/E) plants show higher stable and transient transformation efficiencies than do wild-type plants. Plants were inoculated with Agrobacterium A208 (for tumorigenesis assays) or Agrobacterium At849 (for transient GUS assays) at 106 cells/mL (Klett = 0.1) or 105 cells/mL (Klett = 0.01). As a control to indicate successful transformation, roots of wild-type plants were also inoculated at 108 cells/mL (Klett = 10). At least 15 different plants were tested for each transgenic line and >80 root segments were examined for each plant. Error bars = se. (D) Representative plates of transgenic BTI1 overexpressing (O/E) plants showing increased frequency of tumor formation at low inoculation densities (106 cells/mL [Klett = 0.1] and 105 cells/mL [Klett = 0.01]).
Figure 11.
Figure 11.
Expression Pattern of BTI Proteins in Plant Tissues and Cells. (A) Protein gel blot analysis showing that BTI1 protein is expressed in root tissues, rosette leaves, and the bolt regions of the inflorescence of mature Arabidopsis plants, but not in siliques, flowers, or cauline leaves. BTI1 protein is also expressed in Arabidopsis suspension cells. (B) Confocal fluorescence microscopic images of transgenic Arabidopsis root tips expressing GFP or BTI-GFP fusion proteins. (1) Single optical section of root tip cells from GFP transgenic plants. (2 and 3) Single optical sections of root tip cells from BTI1-GFP transgenic plants. (4) Single optical section of root tip cells from BTI3-GFP transgenic plants. (5) BTI1-GFP protein is not associated with the plant cell wall. BTI1-GFP transgenic plants were treated with 0.8 M mannitol for 30 to 60 min before examining by confocal microscopy. The images indicate that GFP alone localizes through the cytoplasmic region and the nucleus, whereas the BTI-GFP fusion proteins localize throughout the cytoplasm, preferentially to the cell periphery, but not the walls, of root tip cells. Bars (1, 2, 4, and 5) = 25 μm; bar (3) = 5 μm.

Similar articles

Cited by

References

    1. Alonso, J.M., et al. (2003). Genome-wide insertional mutagenesis of Arabidopsis thaliana. Science 301, 653–657. - PubMed
    1. Altschul, S.F., Gish, W., Miller, W., Myers, E.W., and Lipman, D.J. (1990). Basic local alignment search tool. J. Mol. Biol. 215, 403–410. - PubMed
    1. Altschul, S.F., Madden, T.L., Schäffer, A.A., Zhang, J., Zhang, Z., Miller, W., and Lipman, D.J. (1997). Gapped BLAST and PSI-BLAST: A new generation of protein database search programs. Nucleic Acids Res. 25, 3389–3402. - PMC - PubMed
    1. Anthony, K.G., Sherburne, C., Sherburne, R., and Frost, L.S. (1994). The role of the pilus in recipient cell recognition during bacterial conjugation mediated by F-like plasmids. Mol. Microbiol. 13, 939–953. - PubMed
    1. Ausubel, F.M., Brent, R., Kingston, R.E., Moore, D.D., Seidman, J.G., Smith, J.A., and Struhl, K. (2003). Current Protocols in Molecular Biology. (New York: Wiley).

Publication types

MeSH terms