. 2004 Nov;16(11):3132-47.
doi: 10.1105/tpc.104.026120. Epub 2004 Oct 19.

A conserved transcript pattern in response to a specialist and a generalist herbivore

Affiliations

A conserved transcript pattern in response to a specialist and a generalist herbivore

Philippe Reymond et al. Plant Cell. 2004 Nov.

Abstract

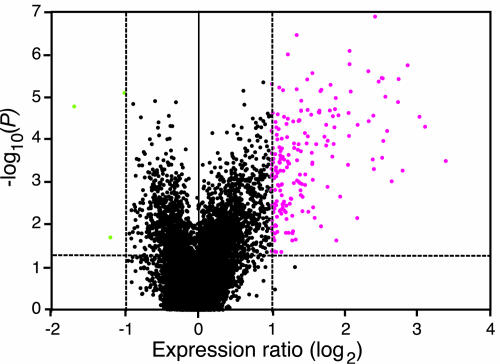
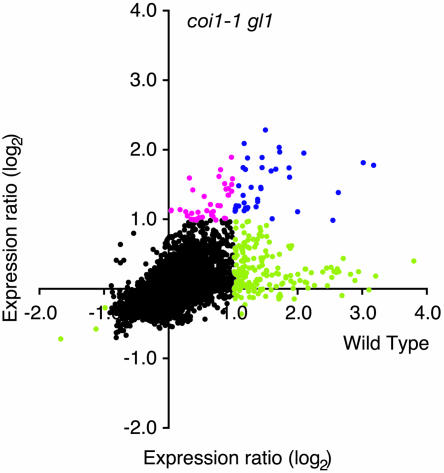
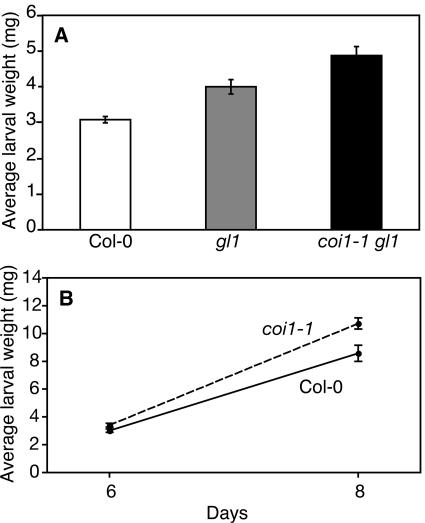
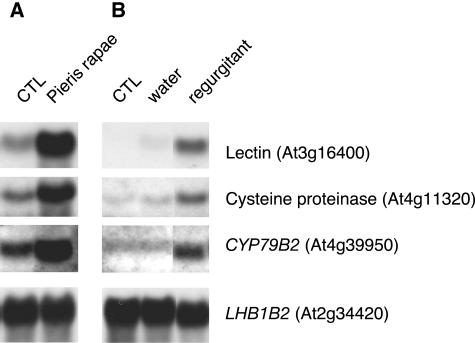
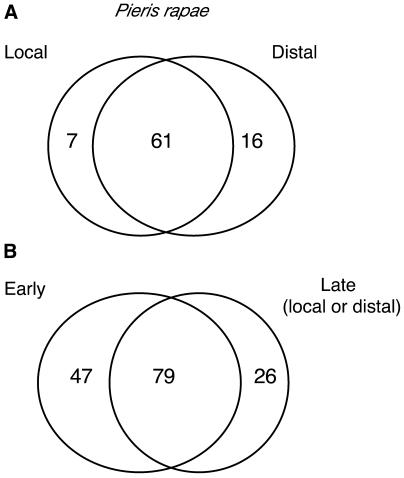
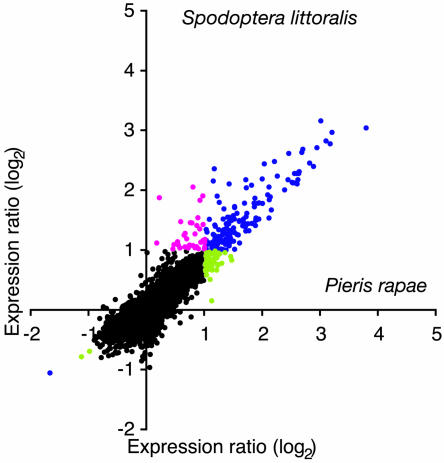
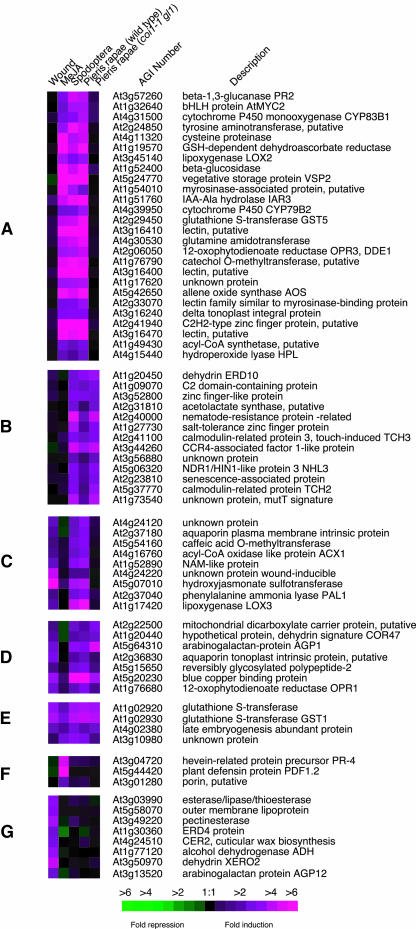
Transcript patterns elicited in response to attack reveal, at the molecular level, how plants respond to aggressors. These patterns are fashioned both by inflicted physical damage as well as by biological components displayed or released by the attacker. Different types of attacking organisms might therefore be expected to elicit different transcription programs in the host. Using a large-scale DNA microarray, we characterized gene expression in damaged as well as in distal Arabidopsis thaliana leaves in response to the specialist insect, Pieris rapae. More than 100 insect-responsive genes potentially involved in defense were identified, including genes involved in pathogenesis, indole glucosinolate metabolism, detoxification and cell survival, and signal transduction. Of these 114 genes, 111 were induced in Pieris feeding, and only three were repressed. Expression patterns in distal leaves were markedly similar to those of local leaves. Analysis of wild-type and jasmonate mutant plants, coupled with jasmonate treatment, showed that between 67 and 84% of Pieris-regulated gene expression was controlled, totally or in part, by the jasmonate pathway. This was correlated with increased larval performance on the coronatine insensitive1 glabrous1 (coi1-1 gl1) mutant. Independent mutations in COI1 and GL1 led to a faster larval weight gain, but the gl1 mutation had relatively little effect on the expression of the insect-responsive genes examined. Finally, we compared transcript patterns in Arabidopis in response to larvae of the specialist P. rapae and to a generalist insect, Spodoptera littoralis. Surprisingly, given the complex nature of insect salivary components and reported differences between species, almost identical transcript profiles were observed. This study also provides a robustly characterized gene set for the further investigation of plant-insect interaction.


Figures

Figure 1.
Figure 1.
Statistical Analysis of Arabidopsis Gene Induction by P. rapae. Volcano plot where gene expression ratios (log2 fold change) are plotted against the negative log10-transformed P values from a t test calculation. Arabidopsis plants were challenged with P. rapae larvae for 3 to 5 h, and gene expression ratios between challenged and unchallenged plants were calculated from five independent replicate experiments. In parallel, expression ratios were obtained from six independent experiments of control versus control plants. Mean log2-transformed expression ratios for both types of comparisons were used for a t test conducted for each gene. The vertical dashed lines represent a twofold threshold in gene induction or repression. The horizontal dashed line represents a significance level of 0.05. Genes with statistically significant differential expression (P < 0.05) and fold change >2 and >−2 are shown in magenta and green, respectively.
Figure 2.
Figure 2.
Contribution of the Jasmonate Pathway to Insect-Inducible Gene Expression. Relative changes in gene expression after challenge with P. rapae were measured in wild-type and coi1-1 gl1 mutant plants. Expression ratios calculated from experiments comparing challenged and unchallenged wild-type plants (five biologically independent replicates) are plotted against expression ratios between challenged and unchallenged coi1-1 gl1 plants (four biologically independent replicates). Black dots represent genes that showed no changes in gene expression (see Methods). Blue dots represent genes that were induced in both genotypes. Magenta dots represent genes only induced in coi1-1 gl1 plants, and green dots represent genes only induced in wild-type plants.
Figure 3.
Figure 3.
Influence of the Jasmonate Pathway on P. rapae Larval Performance. (A) The growth of P. rapae larvae was tested on wild-type, gl1, and coi1-1 gl1 mutant plants. Freshly hatched Pieris larvae were placed simultaneously on each Arabidopsis genotype, and larval weight (mean ± se) was measured after 6 d of feeding. (B) Pieris larvae were placed on wild-type plants and on the non-glabrous coi1-1 mutant, and larval weight (mean ± se) was measured after 6 and 8 d of feeding.
Figure 4.
Figure 4.
Accumulation of Jasmonate Family Members after Challenge with P. rapae. Oxylipins were extracted from leaves at different times after challenge with first-instar P. rapae larvae. Kinetics of OPDA, dnOPDA, and JA accumulation were followed in control (open symbols and dashed lines) and infested (closed symbols and solid lines) plants. Data are the mean ± se of four independent determinations.
Figure 5.
Figure 5.
Insect Regurgitant Stimulates the Expression of Pieris-Inducible Genes. The expression of three defense-related genes was analyzed in plants that were either challenged with P. rapae larvae for 3 to 5 h (A) or treated with oral regurgitant for 6 h (B). For regurgitant treatment, three 1-mm holes per leaf were made and 1 μL of regurgitant obtained from fourth- or fifth-instar larvae was added to each hole. A control with water alone showed very little induction. LHB1B2 was used as a loading control.
Figure 6.
Figure 6.
Comparison of Local and Distal Gene Expression after Insect Feeding. (A) Venn diagram representing the distribution of induced transcripts between damaged (local) and undamaged (distal) leaves. P. rapae larvae were allowed to feed for 3 to 5 h then removed from plants. Plants were left in a growth cabinet under constant illumination for another 24 h until harvesting and microarray analysis. This experiment was repeated three times. (B) Venn diagram representing the distribution of early (3 to 5 h challenge, five independent replicates) and late (3 to 5 h challenge followed by 24 h without larvae, three independent replicates) transcripts. The numbers in the overlapping area indicate the shared number of genes in the comparisons and include genes with an average expression ratio ≥ 2 in one experiment and ≥ 1.5 in the other. Numbers outside the overlapping area represent genes specific for one experiment with an expression ratio ≥ 2 in one experiment and ≤ 1.5 in the other.
Figure 7.
Figure 7.
Comparison of Transcript Profiles between a Specialist and a Generalist Herbivore. Relative changes in gene expression were measured after 3 to 5 h challenge with the specialist P. rapae or the generalist S. littoralis. Expression ratios calculated from experiments comparing Pieris-challenged and unchallenged plants (five biologically independent replicates) are plotted against expression ratios from ratios between Spodoptera-challenged and unchallenged plants (five biologically independent replicates). Black dots represent genes that showed no changes in gene expression (see Methods). Blue dots represent genes that were induced by both insects. Magenta dots represent genes only induced by S. littoralis, and green dots represent genes only induced by P. rapae.
Figure 8.
Figure 8.
Clustered Display of Genes Responding to Insect Feeding, Mechanical Damage, and MeJA Treatment. Hierarchical clusters of selected genes are shown to illustrate differential induction patterns after insect feeding, mechanical damage, and treatment with MeJA. The experiment with coi1-1 gl1 plants challenged with P. rapae is included to visualize the importance of the jasmonate pathway in response to chewing insects. The clusters in (A) to (G) are discussed in the text. Representative genes of each cluster are displayed here.

Similar articles

Cited by

References

    1. Agrawal, A.A. (1998). Induced responses to herbivory and increased plant performance. Science 279, 1201–1202. - PubMed
    1. Agrawal, A.A. (1999). Induced responses to herbivory in wild radish: Effects on several herbivores and plant fitness. Ecology 80, 1713–1723.
    1. Agrawal, A.A., and Kurashige, N.S. (2003). A role for isothiocyanates in plant resistance against the specialist herbivore Pieris rapae. J. Chem. Ecol. 29, 1403–1415. - PubMed
    1. Alborn, H.T., Brennan, M.M., and Tumlinson, J.H. (2003). Differential activity and degradation of plant volatile elicitors in regurgitant of tobacco hornworm (Manduca sexta) larvae. J. Chem. Ecol. 29, 1357–1372. - PubMed
    1. Alborn, H.T., Turlings, T.C.J., Jones, T.H., Stenhagen, G., Loughrin, J.H., and Tumlinson, J.H. (1997). An elicitor of plant volatiles from beet armyworm oral secretion. Science 276, 945–949.

Publication types