. 2004 Oct 20;24(42):9441-50.
doi: 10.1523/JNEUROSCI.3290-04.2004.

Pronounced cell death in the absence of NMDA receptors in the developing somatosensory thalamus

Affiliations

Pronounced cell death in the absence of NMDA receptors in the developing somatosensory thalamus

Suzanne M Adams et al. J Neurosci. .

Abstract

Genetic deletion of NMDA glutamate receptors disrupts development of whisker-related neuronal patterns in the somatosensory system. Independent studies have shown that NMDA receptor antagonists increase cell death among developing neurons. Here, we report that a dramatic feature of the developing somatosensory system in newborn NMDA receptor 1 (NMDAR1) knock-out mice is increased cell death in the ventrobasal nucleus (VB) of the thalamus. Sections were subject to terminal deoxynucleotidyl transferase dUTP nick end labeling staining for apoptotic DNA fragmentation, thionine staining for pyknotic nuclei, silver staining for degenerating cells, and immunostaining for caspase-3. All four methods demonstrated that deletion of NMDAR1 causes a large (on the order of threefold to fivefold) increase in cell death in the VB. The NMDA receptor antagonists dizocilpine maleate (MK-801) and phencyclidine also increase cell death in this structure. The onset of increased cell death in the VB in the absence of NMDA receptor function is approximately the time of birth, overlaps with naturally occurring cell death and synaptogenesis, and displays some anatomical specificity. For example, there was no increase in cell death in the hippocampus or neocortex of NMDAR1 knock-out mice at any of the time points examined: embryonic day 15.5 (E15.5), E17.5, and postnatal day 0. We also report a significant reduction in the size of the VB that is evident starting at E17.5. The results indicate that NMDA receptors play a major role in cell survival during naturally occurring cell death in the VB and demonstrate that cell death is a consideration in NMDA receptor knock-out studies.


Figures

Figure 1.
Figure 1.
The VB in developing NMDAR1 knock-out (-/-) and wild-type (+/+) mice. Examples of anatomically matched thionine-stained coronal sections used for quantification are shown. In each case, the somatosensory thalamus, or its precursor, is outlined: the IL (precursor to the VB) at E15.5 (A), and the VB at E17.5 (B) and P0 (C). Sections were analyzed at three levels (rostral to caudal, I-III) at E15.5 and E17.5 and at four levels (rostral to caudal, I-IV) at P0. Scale bars, 300 μm.
Figure 2.
Figure 2.
The area of the VB is smaller on sections from NMDAR1 knock-out (-/-) than from wild-type (+/+) mice. A, At E15.5, the area of the IL (precursor to the VB) is indistinguishable between wild-type and knock-out animals at all three levels analyzed. B, By E17.5, however, the area of the VB is significantly smaller in NMDAR1 knock-outs at two of three levels examined (I, II; ***p < 0.001). C, Similarly, at P0 the VB is significantly smaller in knock-outs at the two largest levels examined (II, III; **p < 0.01). Levels within each age are separated by 175 μm and are numbered from rostral to caudal. The level numbers do not necessarily indicate analogous levels at different ages (e.g., level I at E17.5 should not be considered the precursor of level I at P0), but rather indicate clearly identifiable levels that were used for area measurements. The bars represent means ± SD.
Figure 3.
Figure 3.
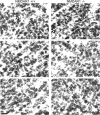
TUNEL staining in the IL (E15.5) and VB (E17.5 and P0) of developing NMDAR1 knock-out (-/-) and wild-type (+/+) mice. Dark staining indicates DNA fragmentation (examples are indicated by arrows). Signal is minimal or absent in both NMDAR1+/+ and NMDAR1-/- fetuses (A, B, D, E). By P0, there is a significant increase in signal, with more DNA fragmentation detected in the VB of knock-outs (F) than in wild-type controls (C). Scale bar, 10 μm.
Figure 4.
Figure 4.
Genetic deletion of NMDAR1 increases the number of pyknotic nuclei in the VB during the peak of naturally occurring cell death. Few pyknotic nuclei are present in the IL at E15.5 (A) and in the VB at E17.5 (B) in both wild-type (+/+) and NMDAR1 knock-out (-/-) animals. By P0 (C), however, numerous pyknotic nuclei were observed, and fourfold to ninefold more pyknotic figures are present in NMDAR1 knock-outs (-/-) than in wild-type (+/+) controls (*p < 0.05; **p < 0.01; ***p < 0.001). The levels are numbered from rostral to caudal, and sections used for counts of pyknotic nuclei are those used for area measurements (see Fig. 2). The bars represent means ± SD.
Figure 5.
Figure 5.
TUNEL staining in the VB of neonatal wild-type (+/+) and NMDAR1 knock-out (-/-) mice treated with vehicle (Control; A, D), MK-801 (B, E), or PCP (C, F). DNA fragmentation is indicated by dark staining (examples are indicated by arrows). Compared with wild-type controls (A), increased TUNEL staining is present in the VB of vehicle-, MK-801-, and PCP-treated knock-out mice (D-F), as well as MK-801- and PCP-treated wild-type mice (B, C). Scale bar, 10 μm.
Figure 6.
Figure 6.
Pyknotic nuclei on thionine-stained sections through the VB from control and NMDA receptor antagonist-treated neonates. A-F, Photomicrographs showing examples of pyknotic nuclei in the VB of wild-type control (A), NMDAR1 knock-out control (B), wild type treated with MK-801 (C), NMDAR1 knock-out treated with MK-801 (D), wild type treated with PCP (E), and NMDAR1 knock-out treated with PCP (F). Compared with wild-type control (A), greater numbers of pyknotic nuclei are present in the VB of NMDAR1 knock-out mice (B, D, F), as well as wild-type mice treated with MK-801 or PCP (C, E). Photomicrographs were taken from level II. The arrows indicate examples of pyknotic nuclei (A, B). Scale bar, 20 μm.
Figure 7.
Figure 7.
Treatment with NMDA receptor antagonists for 24 hr before birth increases pyknotic nuclei in the VB of wild-type animals but has no effect on NMDAR1 knock-outs. Quantitative results are shown for thionine-stained coronal sections at the two rostrocaudal levels at which the area of the VB is largest (see Fig. 1, Table 1), levels II (A) and III (B). Each experimental group (NMDAR1-/- control, NMDAR1-/- plus MK-801, NMDAR1-/- plus PCP, NMDAR1+/+ plus MK-801, and NMDAR1+/+ plus PCP) displays an increase in the number of pyknotic nuclei versus wild-type controls (*p < 0.05; **p < 0.01; ***p < 0.001). This difference is not statistically significant at level II for MK801- and PCP-treated NMDAR1+/+ animals. The bars represent means ± SD.
Figure 8.
Figure 8.
Analysis of degenerating cells in the VB (outlined) by the cupric silver staining method of de Olmos and Ingram (1971). A-F, Low-magnification view of the VB in wild-type control (A), NMDAR1 knock-out (B), wild type treated with MK-801 (C), NMDAR1 knock-out treated with MK-801 (D), wild type treated with PCP (E), and NMDAR1 knock-out treated with PCP (F). Degenerating cells are indicated by dark-colored silver impregnation. H, Hippocampus. Scale bar, 200 μm.
Figure 9.
Figure 9.
Loss of NMDA receptor function increases silver staining in the VB. The number of pixels of cupric silver signal are expressed as percentages of the total number of pixels in the VB. Quantitative results are shown for coronal sections at the two rostrocaudal levels at which the area of the VB is largest (see Fig. 1, Table 1), levels II (A) and III (B). All five experimental groups (NMDAR1-/- control, NMDAR1-/- plus MK-801, NMDAR1-/- plus PCP, NMDAR1+/+ plus MK-801, and NMDAR1+/+ plus PCP) display increased silver staining versus wild-type controls (*p < 0.05; **p < 0.01). These differences are not statistically significant at level II. The bars represent means ± SD.
Figure 10.
Figure 10.
Increased caspase-3 immunostaining in the VB of NMDAR1 knock-out (B) versus wild-type (A) neonates. The arrows indicate the boundary of the VB. Quantification of the number of caspase-3-positive cells within the VB of P0 wild-type mice (analysis was at level II; 147 ± 65 cell/mm2; n = 7 sections, 4 animals) and NMDAR1 knock-out mice (51 ± 33 cell/mm2; n = 9 sections, 5 animals) demonstrates more caspase-3-positive cells in NMDAR1 knock-outs than in wild-type controls (p < 0.01). Scale bar, 100 μm.
Figure 11.
Figure 11.
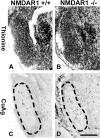
Similar levels of cupric silver staining (CuAg) (method of de Olmos and Ingram, 1971) are present in the PrV of the BSTC in neonatal NMDAR1 wild-type (+/+) and NMDAR1 knock-out (-/-) mice. Thionine-stained (A, B) and silver-stained (C, D) near adjacent coronal sections are shown. The PrV is outlined on silver-stained sections. The group of large cells to the right of the PrV that is seen in A and B is the motor trigeminal nucleus. Scale bar, 250 μm.

Similar articles

Cited by

References

    1. Abel EL, Sokol RJ (1987) Incidence of fetal alcohol syndrome and economic impact of FAS-related anomalies. Drug Alcohol Depend 19: 51-70. - PubMed
    1. Abu-Qare AW, Abou-Donia MB (2001) Biomarkers of apoptosis: release of cytochrome c, activation of caspase-3, induction of 8-hydroxy-2′-deoxyguanosine, increased 3-nitrotyrosine, and alteration of p53 gene. J Toxicol Environ Health B Crit Rev 4: 313-332. - PubMed
    1. Aguayo LG, Albuquerque EX (1987) Phencyclidine blocks two potassium currents in spinal neurons in cell culture. Brain Res 436: 9-17. - PubMed
    1. Akesson E, Kjaeldgaard A, Samuelsson EB, Seiger A, Sundstrom E (2000) Ionotropic glutamate receptor expression in human spinal cord during first trimester development. Brain Res Dev Brain Res 119: 55-63. - PubMed
    1. Altman J, Bayer SA (1988) Development of the rat thalamus: IV. The intermediate lobule of the thalamic neuroepithelium, and the time and site of origin and settling pattern of neurons of the ventral nuclear complex. J Comp Neurol 284: 534-566. - PubMed

Publication types

MeSH terms

LinkOut - more resources