. 2004 Nov 10;23(22):4495-505.
doi: 10.1038/sj.emboj.7600447. Epub 2004 Oct 21.

Mash1 specifies neurons and oligodendrocytes in the postnatal brain

Affiliations

Mash1 specifies neurons and oligodendrocytes in the postnatal brain

Carlos M Parras et al. EMBO J. .

Abstract

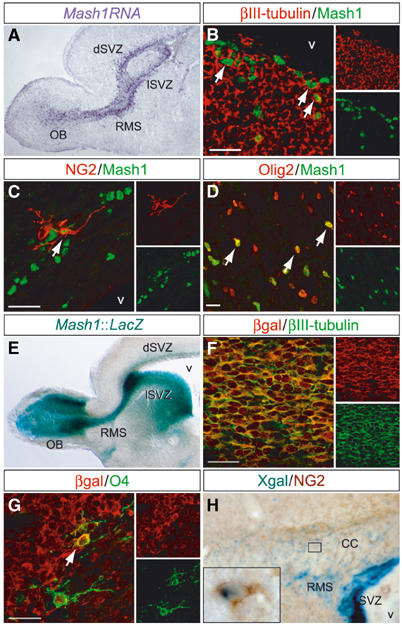
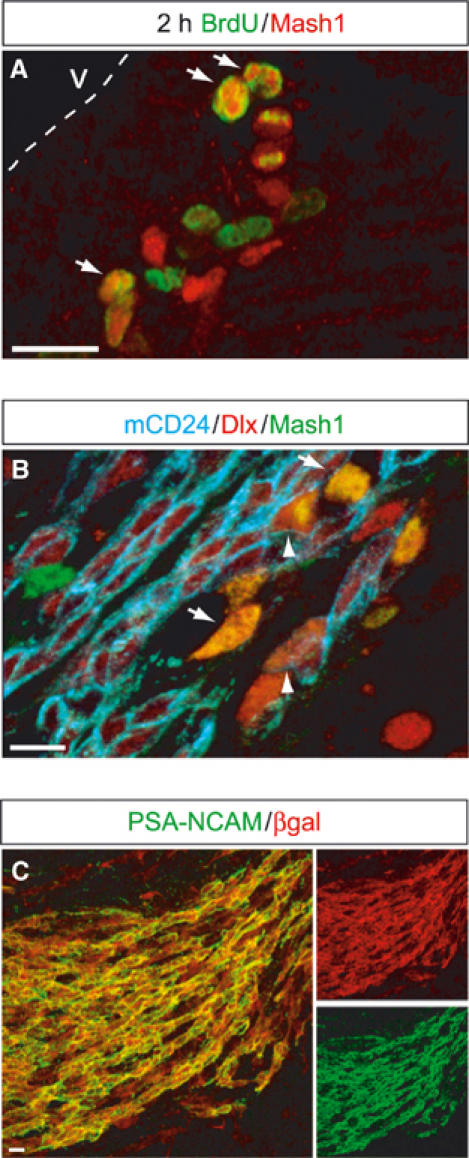
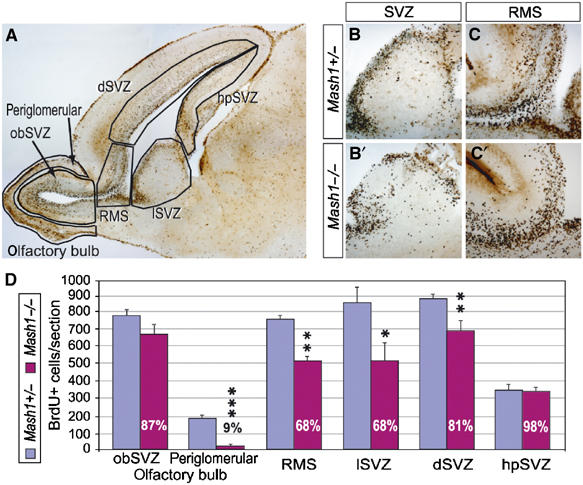
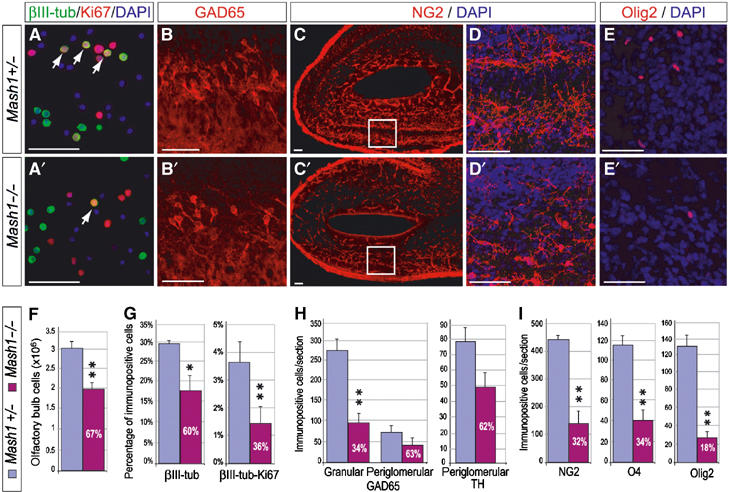
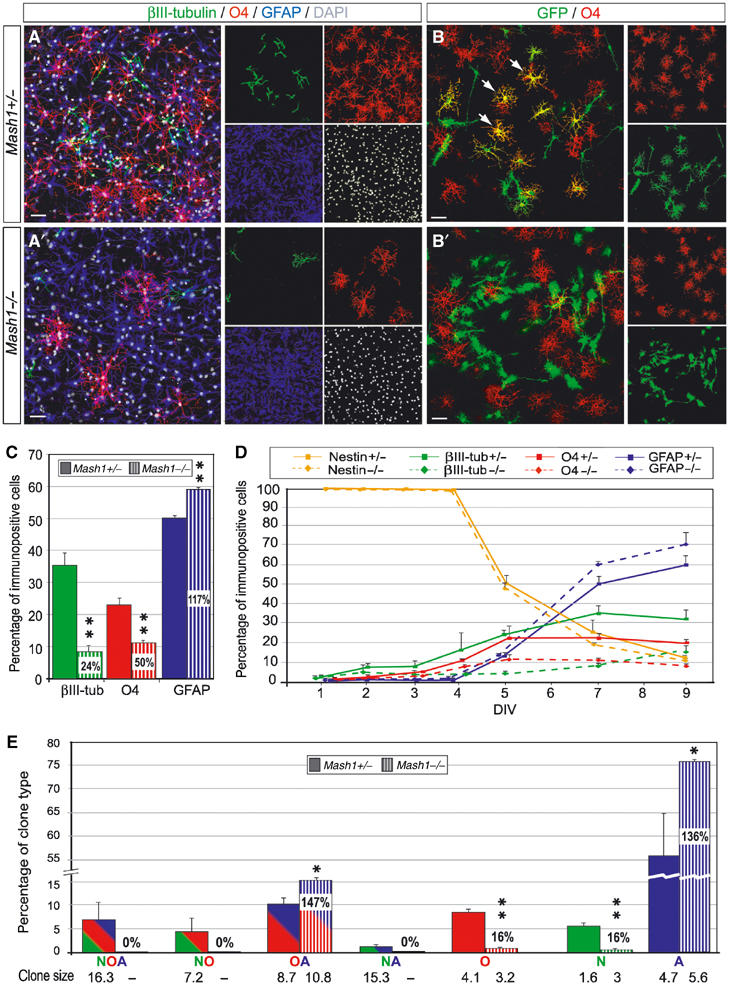
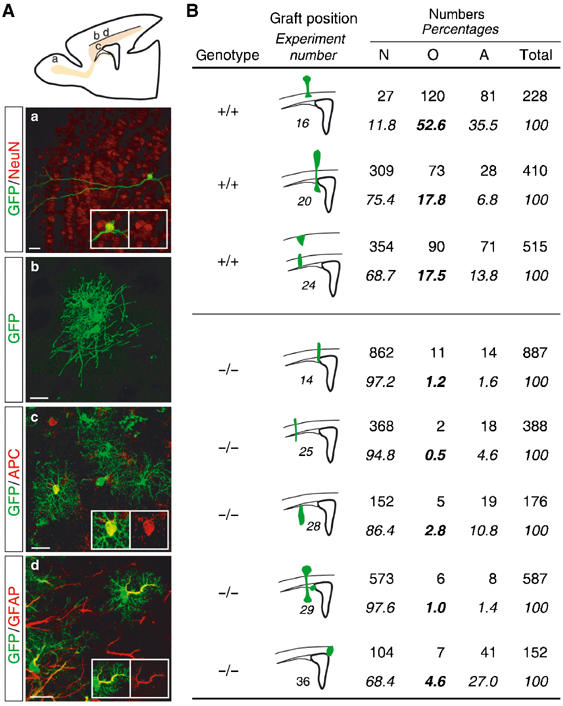
Progenitors in the telencephalic subventricular zone (SVZ) remain mitotically active throughout life, and produce different cell types at embryonic, postnatal and adult stages. Here we show that Mash1, an important proneural gene in the embryonic telencephalon, is broadly expressed in the postnatal SVZ, in progenitors for both neuronal and oligodendrocyte lineages. Moreover, Mash1 is required at birth for the generation of a large fraction of neuronal and oligodendrocyte precursors from the olfactory bulb. Clonal analysis in culture and transplantation experiments in postnatal brain demonstrate that this phenotype reflects a cell-autonomous function of Mash1 in specification of these two lineages. The conservation of Mash1 function in the postnatal SVZ suggests that the same transcription mechanisms operate throughout life to specify cell fates in this structure, and that the profound changes in the cell types produced reflect changes in the signalling environment of the SVZ.


Figures

Figure 1
Figure 1
Mash1-expressing cells in the neonatal SVZ belong to two cell lineages. (A) Mash1 transcripts (purple) in a sagittal section through the rostral telencephalon of a P0 mouse are found in the dorsal and lateral parts of the SVZ (dSVZ and lSVZ, respectively), along the rostral migratory stream (RMS) and in the centre of the olfactory bulb. (B–D) Double antibody labelling of sagittal sections of a P0 brain showing Mash1+ cells (green) coexpressing the neuronal marker βIII-tubulin (B, red) and the oligodendrocyte precursor markers NG2 (C, red) and Olig2 (D, red). Double-labelled cells are marked by arrows. (E) X-gal staining of a sagittal brain section from a P3 Mash1LacZ transgenic mouse, showing the distribution of Mash1-βgal+ cells. (F, G) Double labelling of a sagittal brain section from a P0 transgenic mouse for βgal (red) and βIII-tubulin (F, green) or the OPC marker O4 (G, green, arrow). (H) Double labelling of a sagittal brain section from a P7 transgenic mouse for βgal (blue, X-gal precipitate) and NG2 (brown). The inset is an enlargement of the area outlined in the corpus callosum (CC). Scale bars: 20 μm.
Figure 2
Figure 2
Mash1+ cells in the adult SVZ are progenitors of the olfactory interneuron lineage. (A) Double labelling of a sagittal section through the SVZ of an 8-week-old brain, for Mash1 (red) and BrdU (green) after 2 h of BrdU incorporation. Double-labelled cells are indicated by arrows. (B) Triple labelling for Mash1 (green), the progenitor and neuroblast marker Dlx (red) and the neuroblast marker mCD24 (blue). Mash1+ transit amplifying progenitors (Dlx−, mCD24− and Dlx+, mCD24−) are marked by arrows and Mash1+ neuroblasts (Dlx+, mCD24+) by an arrowhead. (C) Double labelling of a sagittal section through the RMS of an 8-week-old Mash1-LacZ transgenic mouse, for βgal (red) and the neuroblast marker PSA-NCAM (green). Most neuroblasts in the RMS are double labelled. Scale bars: 20 μm.
Figure 3
Figure 3
Less dividing progenitors are found in the SVZ and RMS of Mash1 mutants at birth. (A) Sagittal section of P0 brain showing the different zones used to quantify the defects in BrdU incorporation reported in (A). (B, B′, C, C′) Distribution of BrdU+ cells in the SVZ (B, B′) and proximal RMS (C, C′) of P0 control (B, C) and Mash1 mutants (B′, C′), after 30 min of BrdU incorporation. (D) Quantification of BrdU+ cells in different brain regions, as defined in (A), in P0 control (blue bars) and Mash1 mutants (purple bars). White numbers in purple bars are ratios of BrdU+ cell numbers in Mash1 mutants over controls. *P<0.05, **P<0.01, ***P<0.001, Student's t-test.
Figure 4
Figure 4
Reduced number of neuronal and oligodendrocyte precursors in the olfactory bulb of Mash1 mutants at birth. (A, A′) Double labelling for βIII-tubulin (green) and Ki67 (red) and counterstaining with DAPI (blue), to identify double-labelled neuronal precursors (arrows) in acutely dissociated olfactory bulb cells from P0 control (A) and Mash1 mutant (A′). (B–E, B′–E′) Sagittal sections of olfactory bulb from P0 control (B–E) and Mash1 mutant (B′–E′), labelled for the GABAergic neuron marker GAD65 (B, B′) and the OPC markers NG2 (C, C′, D, D′) and Olig2 (E, E′). (F, G) Quantification of all cells (F), and of neurons and neuronal precursors (G) in acutely dissociated control (blue bars) and Mash1 mutant (purple bars) bulb. (H, I) Quantification of GAD65+ neurons in the granular and periglomerular layers and of TH+ dopaminergic neurons (H), NG2+, O4+ and Olig2+ OPCs (I) in sagittal sections of control and Mash1 mutant bulb. White numbers in purple bars are ratios of numbers of labelled cells in Mash1 mutants over controls. *P<0.05, **P<0.01, Student's t-test. Scale bars: 20 μm.
Figure 5
Figure 5
Defect in specification of neurons and oligodendrocytes in Mash1 mutant progenitor cultures. (A, A′) Triple labelling for βIII-tubulin (green), O4 (red) and GFAP (blue) and counterstaining with DAPI (white) in control (A) and mutant (A′) dissociated neurosphere cultures after 7 days. (B, B′) Double labelling for GFP (green) and O4 (red) in clonal cultures of GFP+ control (B) or mutant (B′) progenitors cocultivated with an excess of GFP-negative wild-type progenitors. The arrows mark GFP+ oligodendrocytes in the wild-type clone (B), which are absent in the mutant clone (B′). (C) Quantification of neurons (βIII-tubulin+), oligodendrocytes (O4+) and astrocytes (GFAP+) in control and mutant cultures after 7 days. White numbers in striped bars are ratios of numbers of labelled cells in mutants over control cultures. (D) Time course of the generation of neurons, oligodendrocytes and astrocytes in control and mutant progenitor cultures. (E) Quantification of the different types of clones generated in control and mutant progenitor cultures. Each pair of bars represents the frequency, in control and mutant cultures, of a particular type of clone, whose cell type composition is indicated by a colour code and letter code under the bars (N: neurons in green; O: oligodendrocytes in red; A: astrocytes in blue). The average size of each type of clone is indicated under the corresponding bar. *P<0.05, **P<0.01, Student's t-test. Scale bars: 10 μm.
Figure 6
Figure 6
Transplanted Mash1 mutant SVZ cells produce less oligodendrocytes in vivo. (A) Identification of transplanted cells by GFP immunoreactivity (green, a–d) and characterisation of their cell type by their typical morphologies (a, neurons; b and c, oligodendrocytes; d, astrocytes) and by double labelling in red for the neuronal marker NeuN (a), the oligodendrocytic marker APC (c) or the astrocytic marker GFAP (d). The drawing of a brain shows where panels a–d are located. Neurons derived from transplanted SVZ cells are mostly located in the olfactory bulb, while oligodendrocytes and astrocytes are mostly located in the cerebral cortex and corpus callosum. (B) Quantification of the cell types of transplanted cells. The genotype of transplanted cells, the position of the grafts and the number and percentage of neurons (N), oligodendrocytes (O) and astrocytes (A) are indicated. The ratio of different cell types varies greatly among control transplanted brains as well as Mash1 mutant transplanted brains, but, overall, Mash1 mutant cells differentiate less in oligodendrocytes than wild-type cells. The lack of an apparent defect in neuronal differentiation of Mash1 mutant cells may be due to the location of the grafts in primarily gliogenic areas. Scale bars: 20 μm.

References

    1. Alvarez-Buylla A, Garcia-Verdugo JM (2002) Neurogenesis in adult subventricular zone. J Neurosci 22: 629–634 - PMC - PubMed
    1. Bertrand N, Castro DS, Guillemot F (2002) Proneural genes and the specification of neural cell types. Nat Rev Neurosci 3: 517–530 - PubMed
    1. Casarosa S, Fode C, Guillemot F (1999) Mash1 regulates neurogenesis in the ventral telencephalon. Development 126: 525–534 - PubMed
    1. Doetsch F, Caille I, Lim DA, Garcia-Verdugo JM, Alvarez-Buylla A (1999) Subventricular zone astrocytes are neural stem cells in the adult mammalian brain [In Process Citation]. Cell 97: 703–716 - PubMed
    1. Doetsch F, Petreanu L, Caille I, Garcia-Verdugo JM, Alvarez-Buylla A (2002) EGF converts transit-amplifying neurogenic precursors in the adult brain into multipotent stem cells. Neuron 36: 1021–1034 - PubMed

Publication types

MeSH terms

Substances