. 2004 Nov 10;23(22):4473-83.
doi: 10.1038/sj.emboj.7600423. Epub 2004 Oct 21.

An alternative strategy for bacterial ribosome synthesis: Bacillus subtilis rRNA transcription regulation

Affiliations

An alternative strategy for bacterial ribosome synthesis: Bacillus subtilis rRNA transcription regulation

Libor Krásný et al. EMBO J. .

Abstract

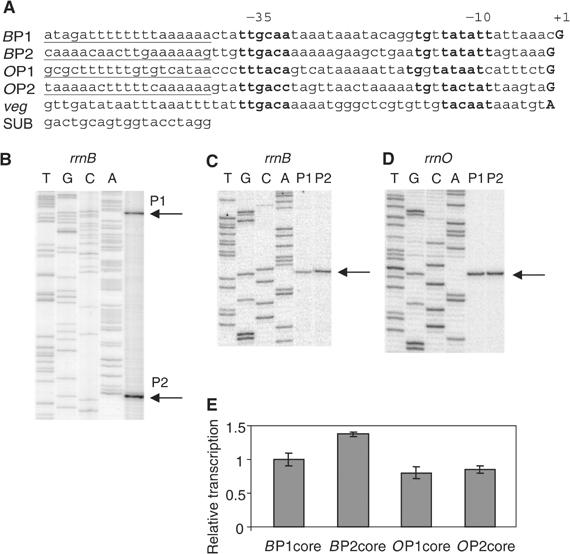
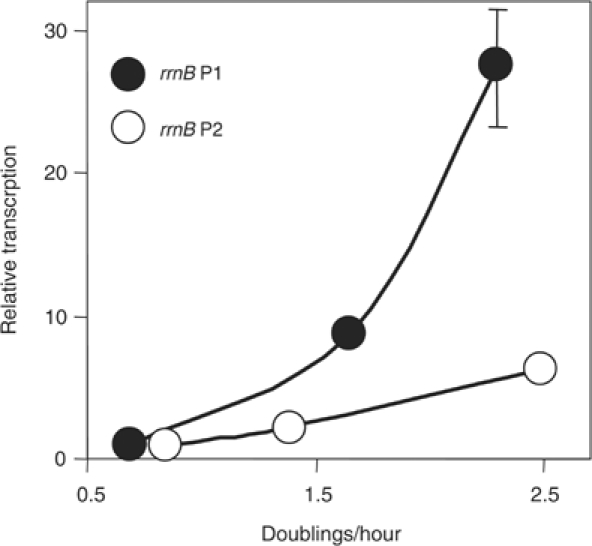
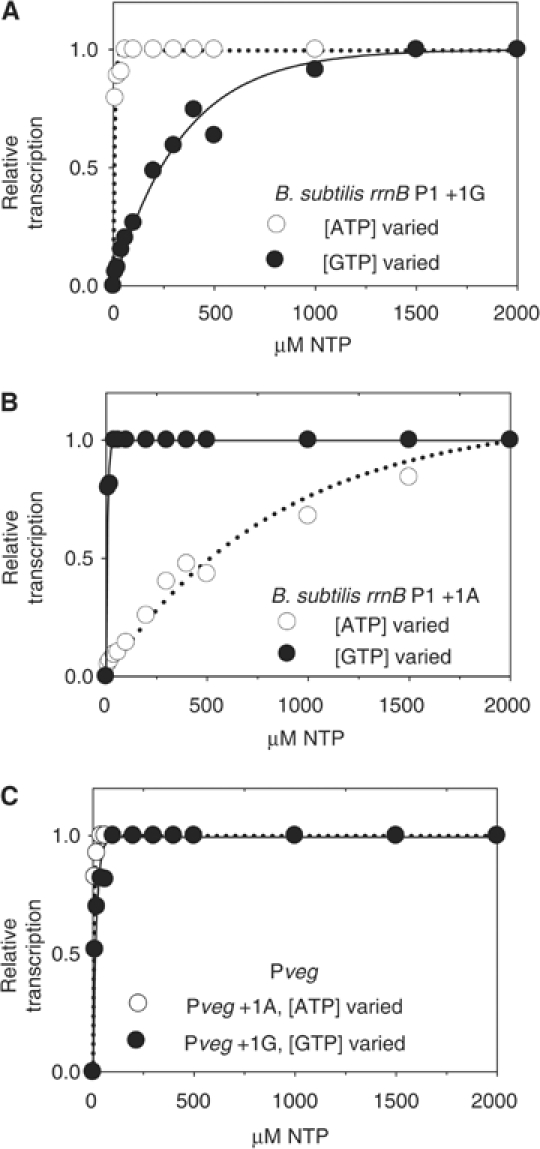
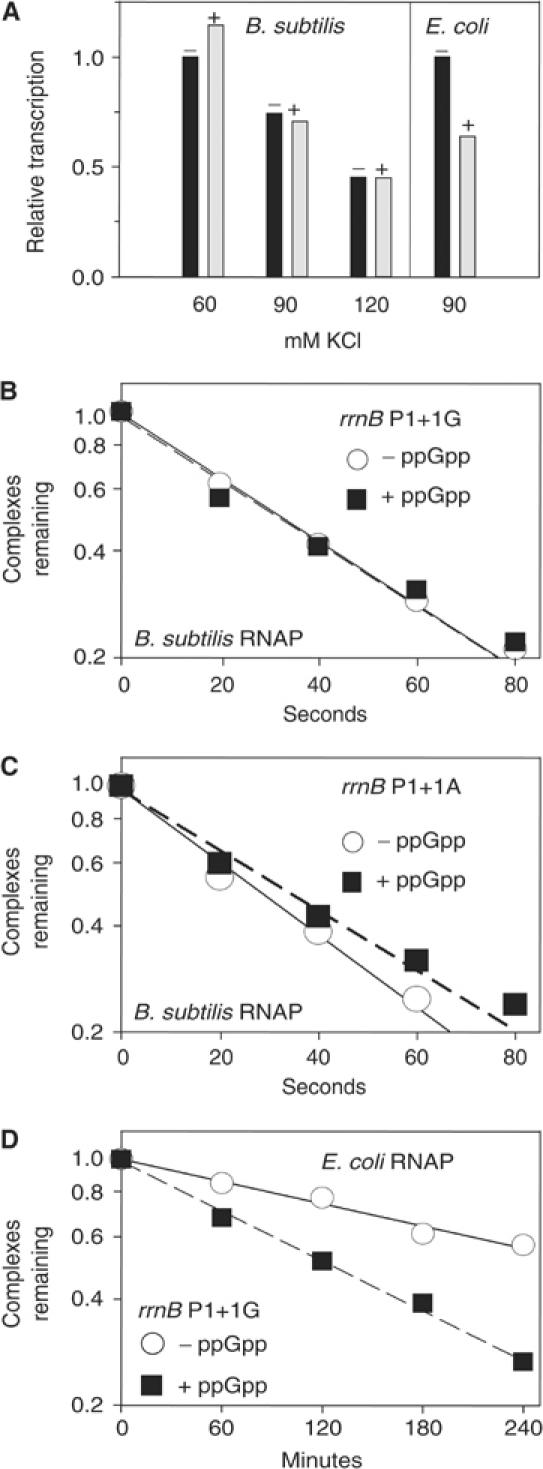
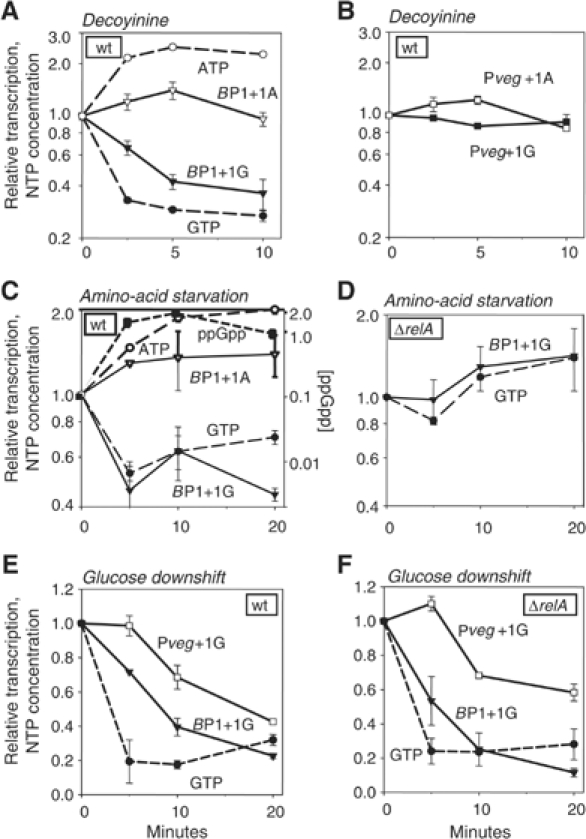
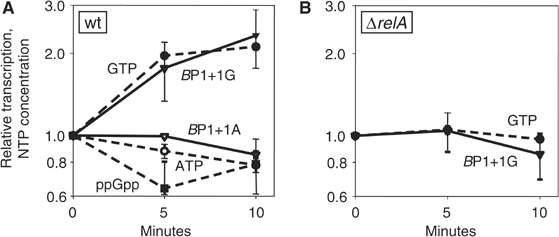
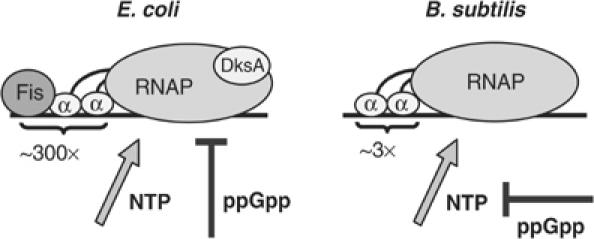
As an approach to the study of rRNA synthesis in Gram-positive bacteria, we characterized the regulation of the Bacillus subtilis rrnB and rrnO rRNA promoters. We conclude that B. subtilis and Escherichia coli use different strategies to control rRNA synthesis. In contrast to E. coli, it appears that the initiating NTP for transcription from B. subtilis rRNA promoters is GTP, promoter strength is determined primarily by the core promoter (-10/-35 region), and changes in promoter activity always correlate with changes in the intracellular GTP concentration. rRNA promoters in B. subtilis appear to be regulated by changes in the initiating NTP pools, but in some growth transitions, changes in rRNA promoter activity are also dependent on relA, which codes for ppGpp synthetase. In contrast to the situation for E. coli where ppGpp decreases rRNA promoter activity by directly inhibiting RNA polymerase, it appears that ppGpp may not inhibit B. subtilis RNA polymerase directly. Rather, increases in the ppGpp concentration might reduce the available GTP pools, thereby modulating rRNA promoter activity indirectly.


Figures

Figure 1
Figure 1
(A) Sequences of B. subtilis promoter constructs used in this study. Putative −10 and −35 hexamers and the +1 positions are in bold. Putative UP elements are underlined. Core promoter constructs contain native sequence from 3 bp upstream of the −35 element (−39 in rrnB P1) to +1. The arbitrary triplet TCT was inserted adjacent to the +1 position, followed by the HindIII site, to avoid positioning an A next to +1. In indicated core promoter constructs, the SUB sequence (Rao et al, 1994) was substituted for the same length of native sequence upstream of the −35 element. The veg promoter is described in the text. (B) Primer extension mapping of start sites from cells grown in rich medium containing a B. subtilis rrnB P1–P2 tandem promoter construct (RLG6930; contains rrnB sequence from −248 upstream of BP1 to +8 of BP2). (C, D) Primer extension mapping of start sites from isolated B. subtilis rrnB and rrnO P1 and P2 promoter constructs (−39 to +1 for BP1, −38 to +1 for BP2, OP1, and OP2 (RLG7554, RLG7553, RLG7369, and RLG7370, respectively). Since the isolated P1 and P2 promoters make the same RNA in these fusions, the primer extension products migrate to the same position in the gel. Arrows indicate start sites. Sequencing ladders are shown for P1 promoters only. (E) Relative activities of rrnB and rrnO core promoters. Cells containing the core promoter constructs used in (C, D) were grown concurrently in LB to OD600 ∼0.3, and promoter activities were measured by primer extension, normalized to cell density and to the same RNA recovery marker (see Materials and methods). Activities are in arbitrary units, relative to the rrnB P1 core promoter.
Figure 2
Figure 2
Contribution of sequences upstream of the −35 element to B. subtilis rRNA promoter activity. (A) Representative primer extension bands from RNAs synthesized in cells grown in LB medium from B. subtilis rrnB P1 and rrnB P2 (promoter end points: BP1 core: −39 to +1, RLG7554; BP1 SUB: −39 to +1, RLG7372; BP1 UP: −58 to +1, RLG7373; BP1 long: −352 to +1, RLG7584; BP2 SUB: −38 to +1, RLG7374; BP2 UP: −57 to +1, RLG7375). The test (T) and recovery marker (RM) reverse transcripts are indicated (see also Materials and methods). (B) Effects of upstream sequences on transcription from BP1 and BP2 (constructs described in panel A, normalized to the activity of BP1 SUB). (C) Effects of upstream sequences on transcription from rrnO P1 and rrnO P2 (OP1 core: −38 to +10, RLG7027; OP1 UP: −77 to +10, RLG7028; OP1 long: −227 to +10, RLG7030; OP2 core: −38 to +10, RLG6937; OP2 UP: −77 to +10, RLG7029). Promoter activities are normalized to OP1 core. (D, E) Effect of upstream sequences on in vitro transcription from (D) B. subtilis rrnB P1 using B. subtilis (B.s.) RNAP and supercoiled templates containing B.s. BP1 SUB (−39 to +1, pRLG7599) or B.s. BP1 UP (−58 to +1, pRLG7598) or (E) E. coli rrnB P1 using E. coli (E.c.) RNAP and supercoiled templates containing E.c. BP1 SUB (−41 to +50, pRLG2230) or E.c. BP1 UP (−66 to +50, pRLG6214). Promoter activities are from quantitation (phosphorimager units) of the in vitro transcripts shown at the top of the panels. The fold effect of the B. subtilis rrn P1 upstream sequence varied from 1.3- to 1.6-fold, while the fold effect of the E. coli rrn P1 upstream sequence varied from 15- to 30-fold. (F) Effect of E. coli rrnB P1 UP element on transcription in vivo in E. coli. Transcripts were measured by primer extension from RNAs transcribed from E. coli rrnB P1 SUB (−39 to +50, RLG3097) and E. coli rrnB P1 UP (−66 to +50, RLG3074) constructs in single copy in the E. coli chromosome. Activities are normalized to the core promoter construct. (G) Effect of a B. subtilis hag promoter UP element on transcription in B. subtilis using the same methods as in (A–C). B. subtilis promoters (hag core, −43 to +4, RLG7391; hag promoter with upstream sequences=hag UP, −96 to +4, RLG7392) were integrated in the B. subtilis chromosome. The activity of hag UP is normalized to hag core. For the experiments in panels A–C and F, total RNA was extracted in early exponential phase (OD600 ∼0.3) from cells grown in LB for at least four doublings. In (G), RNA was extracted from cells in late exponential phase (OD600∼2.0) when the hag promoter is most active.
Figure 3
Figure 3
Growth rate-dependent control of B. subtilis rRNA promoters (rrnB P1: −39 to +1, RLG7554; rrnB P2: −38 to +1, RLG7553). Promoter activity (arbitrary units) was measured by primer extension from RNA extracted from cells grown in different media. Slowest to fastest growth rate: (i) MOPS, 1% glucose, phenylalanine and tryptophan; (ii) MOPS, 1% glucose, 20 amino acids; (iii) LB. To facilitate comparison of slopes, promoter activities were normalized to the activity of its own promoter at the lowest growth rate.
Figure 4
Figure 4
Effects of changing NTP concentration on rrnB P1 promoter activity in vitro. B. subtilis promoters on supercoiled templates were transcribed with B. subtilis RNAP and normalized to transcription at the highest NTP concentration (2000 μM). Transcription (arbitrary units) from (A) rrnB P1+1G (pRLG7596), (B) rrnB P1+1A (pRLG7597), and (C) Pveg+1A (pRLG7595) or +1G (pRLG7558) at varying ATP or GTP concentration.
Figure 5
Figure 5
Effect of ppGpp on transcription by B. subtilis and E. coli RNAP in vitro. (A) Single round transcription from B. subtilis rrnB P1+1G (pRLG7596) with B. subtilis RNAP and from E. coli rrnB P1 (pRLG6555) with E. coli RNAP. (+), ppGpp added at 0.5 mM. (B–D) Effect of ppGpp on open complex lifetime. Y-axis, fraction of competitor-resistant complexes. Representative experiments are shown; absolute values of the half-lives varied by only ∼5% in different experiments. (B) B. subtilis rrnB P1+1G (pRLG7596) with B. subtilis RNAP. (C) B. subtilis rrnB P1+1A (pRLG7597) with B. subtilis RNAP. (D) B. subtilis rrnB P1+1G (pRLG7596) with E. coli RNAP.
Figure 6
Figure 6
Correlation between GTP concentration and B. subtilis rrnB P1 promoter activity following three kinds of downshifts. NTP concentrations (dashed lines) and promoter activities (solid lines) are normalized to 1 at time 0. The GTP concentration was 45, 18, and 46% of the ATP concentration at time 0 in panels A, C, and E, respectively. Promoter activities were measured by primer extension from a wild-type strain: rrnB P1+1G (RLG7554), rrnB P1+1A (RLG7585), Pveg+1G (RLG7555), Pveg+1A (RLG7376), or from a ΔrelA strain: rrnB P1+1G (RLG7580), Pveg+1G (RLG7581). (A, B) Changes in promoter activity and NTP concentration after decoyinine addition. Cells were grown in a medium containing MOPS, 1% glucose, and 20 amino acids (50 μg/ml each). Decoyinine (final concentration 0.5 mg/ml) was added to exponentially growing cells at time 0 (OD600∼0.3). (C) Effect of amino-acid starvation on B. subtilis rrnB P1 promoter activity. Cells were grown in a medium containing MOPS, 0.4% glucose, and six amino acids (FILMVW). Serine hydroxamate (1.5 mg/ml final concentration) was added to exponentially growing cells at time 0 (OD600∼0.25). The ppGpp concentration is presented relative to the GTP concentration. Note the different scale for ppGpp. (D) Effect of amino-acid starvation on B. subtilis rrnB P1 promoter activity in a ΔrelA strain. Conditions are as in (C). (E) Effect of glucose deprivation on B. subtilis rrnB P1 promoter activity. Cells were grown in a medium containing MOPS, 0.2% glucose, and 20 amino acids. α-Methyl glucoside (final concentration 2%) was added to exponentially growing cells at time 0 (OD600∼0.3). The decrease in ATP concentration was ∼2-fold by 5 min (data not shown). (F) Effect of glucose deprivation on B. subtilis rrnB P1 promoter activity in a ΔrelA strain. Conditions are as in (E).
Figure 7
Figure 7
Effect of amino-acid upshift on B. subtilis rrnB P1 promoter activity. Cells were grown in MOPS, 0.2% glucose, and six amino acids (FILMVW, 50 μg/ml each). The remaining 14 amino acids were added to exponentially growing cells at time 0 (OD600∼0.25) to a final concentration of 50 μg/ml each. Promoter activity was measured by primer extension from rrnB P1+1G (RLG7554) and rrnB P1+1A (RLG7585) in (A) and from rrnB P1+1G (RLG7580) in (B) (ΔrelA). NTP concentrations are normalized to 1.0 at time zero. The GTP concentration was ∼16% of the ATP concentration and ppGpp was ∼10% of the GTP concentration at time 0.
Figure 8
Figure 8
Schematic diagram illustrating mechanisms contributing to rrn P1 promoter activity in E. coli versus B. subtilis. The transcription factor Fis and RNAP αCTD binding to UP element DNA account for the unusually high activity of rrn P1 promoters from E. coli, but not B. subtilis. Changing NTP and ppGpp concentrations regulate rRNA promoter activities in both bacteria, but in B. subtilis ppGpp may inhibit rRNA transcription indirectly by reducing GTP levels. For the sake of simplicity (and since its effect on B. subtilis rRNA promoters was not examined), H-NS is not pictured.

Similar articles

Cited by

References

    1. Artsimovitch I, Patlan V, Sekine S, Vassylyeva MN, Hosaka T, Ochi K, Yokoyama S, Vassylyev DG (2004) Structural basis for transcription regulation by alarmone ppGpp. Cell 117: 299–310 - PubMed
    1. Artsimovitch I, Svetlov V, Anthony L, Burgess RR, Landick R (2000) RNA polymerases from Bacillus subtilis and Escherichia coli differ in recognition of regulatory signals in vitro. J Bacteriol 182: 6027–6035, Erratum (2001) J Bacteriol 183: 1504 - PMC - PubMed
    1. Barker MM (2001) PhD Thesis, University of Wisconsin-Madison
    1. Barker MM, Gaal T, Josaitis CA, Gourse RL (2001) Mechanism of regulation of transcription initiation by ppGpp. I. Effects of ppGpp on transcription initiation in vivo and in vitro. J Mol Biol 305: 673–688 - PubMed
    1. Barker MM, Gourse RL (2001) Regulation of rRNA transcription correlates with nucleoside triphosphate sensing. J Bacteriol 183: 6315–6323 - PMC - PubMed

Publication types

MeSH terms