. 2005 Jan 7;232(1):71-81.
doi: 10.1016/j.jtbi.2004.07.026.

Network theory and SARS: predicting outbreak diversity

Affiliations

Network theory and SARS: predicting outbreak diversity

Lauren Ancel Meyers et al. J Theor Biol. .

Abstract

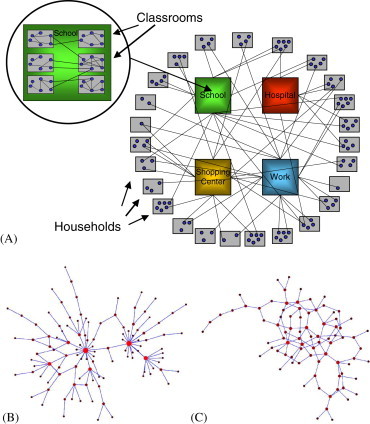
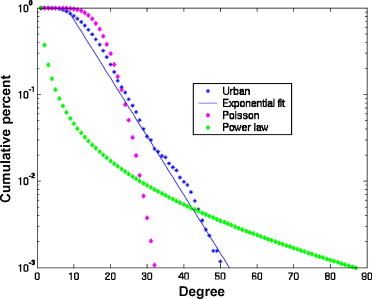
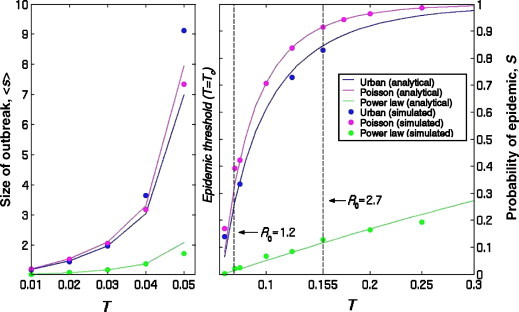
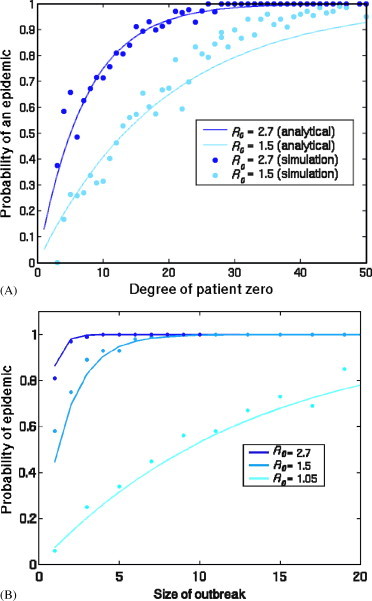
Many infectious diseases spread through populations via the networks formed by physical contacts among individuals. The patterns of these contacts tend to be highly heterogeneous. Traditional "compartmental" modeling in epidemiology, however, assumes that population groups are fully mixed, that is, every individual has an equal chance of spreading the disease to every other. Applications of compartmental models to Severe Acute Respiratory Syndrome (SARS) resulted in estimates of the fundamental quantity called the basic reproductive number R0--the number of new cases of SARS resulting from a single initial case--above one, implying that, without public health intervention, most outbreaks should spark large-scale epidemics. Here we compare these predictions to the early epidemiology of SARS. We apply the methods of contact network epidemiology to illustrate that for a single value of R0, any two outbreaks, even in the same setting, may have very different epidemiological outcomes. We offer quantitative insight into the heterogeneity of SARS outbreaks worldwide, and illustrate the utility of this approach for assessing public health strategies.


Figures

Fig. 1
Fig. 1
Schemata of: (A) urban, (B) power law, and (C) Poisson networks. Dots represent individuals and lines between dots represent contacts between individuals that could potentially lead to disease transmission.
Fig. 2
Fig. 2
Cumulative degree distributions for simulated urban, Poisson, and power law networks. As described in the text, these share the same epidemic threshold (Tc). Each line gives the probability that a randomly chosen individual (vertex) will have at least the number of contacts (degree) indicated on the x-axis. The degree distribution for the urban network is nearly exponential for degrees greater than ten.
Fig. 3
Fig. 3
Predicting outbreaks and epidemics. The left graph illustrates the average number of people infected in a small outbreak, 〈s〉, when T is below the epidemic threshold. The right graph illustrates S, the probability that an epidemic occurs when T is above the epidemic threshold. S also equals the expected fraction of the population infected during an epidemic, should one occur. The vertical lines correspond to recent estimates of R0 for SARS pre-intervention (right) and post-intervention (left) (Chowell and Fenimore, 2003a, Chowell and Hyman, 2003b; Lipsitch et al., 2003; Riley et al., 2003). Note that we chose the parameters for the power law and Poisson networks so that for any value of T, all three networks share the same R0. Simulation values are based on 2571 simulated epidemics, each starting with a unique individual in the network.
Fig. 4
Fig. 4
Predicting an epidemic from initial conditions. (A) The probability that patient zero will ignite a full-blown epidemic increases monotonically with his or her degree. The calculations are based on the simulated urban network. Simulation values are based on 2571 simulated epidemics, one for every unique patient zero in the network. Discrepancy between simulations and analysis is likely caused by the finite size of the network, which contains very few high degree vertices, and by the intrinsic community structure in which high degree vertices (like teachers and caregivers) are preferentially connected to each other. (B) The probability of a full-blown epidemic in the simulated urban network increases with the size of the initial outbreak. This calculation does not assume knowledge of the specific degrees of the individuals affected in the outbreak, information that would improve the prediction. For each circle in the graph, we ran 100 simulations starting with the appropriate number of randomly selected initial cases and calculated the fraction of those outbreaks that gave rise to an epidemic.
Fig. 5
Fig. 5
Individual intervention. The probability that an individual will become infected increases with the extent of personal precautions and the average transmissibility of the disease (calculated for a simulated urban network). For example, the 25% lines indicate the risk of infection if an individual who either reduces his/her contacts by 25% or lowers the likelihood of transmission per contact by 25%.
Fig. 6
Fig. 6
Demographics of intervention. The impact of contact-reducing interventions varies by demographic sector. Health care workers are most at risk followed by school children, working adults, and non-working adults. Light bars reflect baseline risk before intervention and dark bars reflect reduced risk to an individual who limits his or her contacts to half of the previous amount. Error bars are 95% confidence intervals that reflect underlying diversity of contact patterns within each demographic sector.

References

    1. Anderson R.M., May R.M. Oxford University Press; Oxford: 1991. Infectious Diseases of Humans, Dynamics and Control.
    1. Bailey N.T.J. Hafner Press; New York: 1975. The Mathematical Theory of Infectious Diseases and Its Applications.
    1. Ball F., Mollison D., Scalia-Tomba G. Epidemics with two levels of mixing. Ann. Appl. Probab. 1997;7:46.
    1. Barabasi A.L., Albert R. Emergence of scaling in random networks. Science. 1999;286:509. - PubMed
    1. BC Stats, 2002. Labour Force—Employment, Unemployment, Related Rates, BC Stats.

Publication types