Review
. 2005 Jan 1;562(Pt 1):121-9.
doi: 10.1113/jphysiol.2004.076273. Epub 2004 Oct 21.

The 'window' T-type calcium current in brain dynamics of different behavioural states

Affiliations
Review

The 'window' T-type calcium current in brain dynamics of different behavioural states

Vincenzo Crunelli et al. J Physiol. .

Abstract

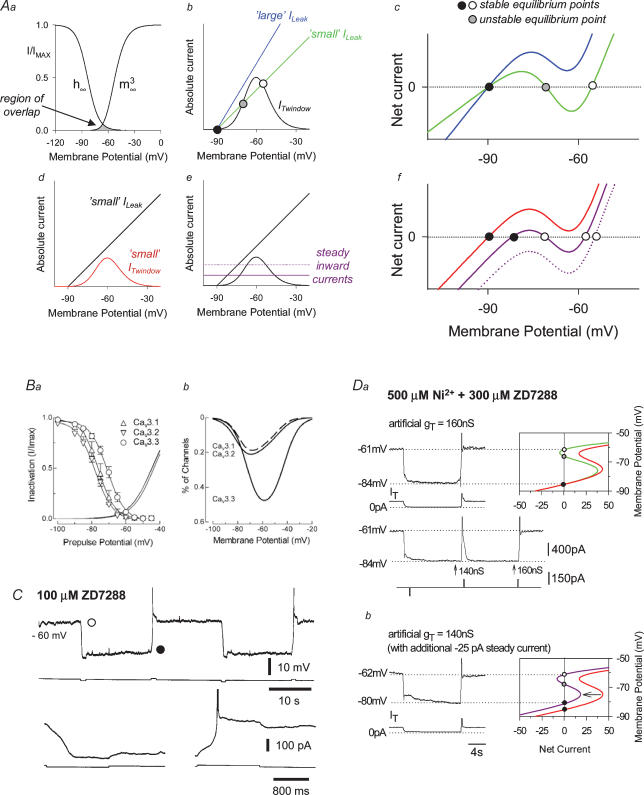
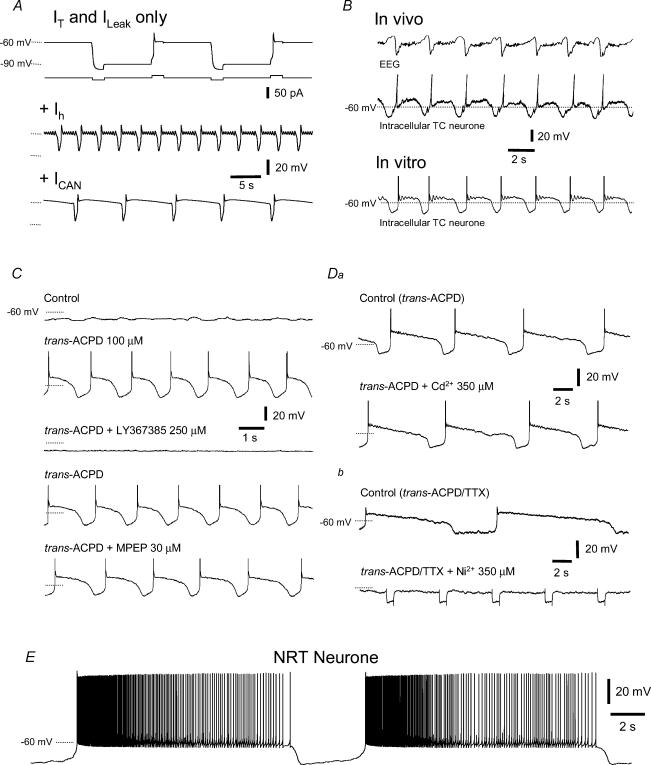
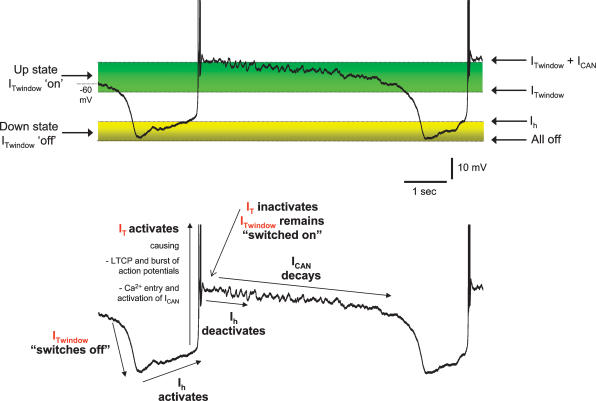
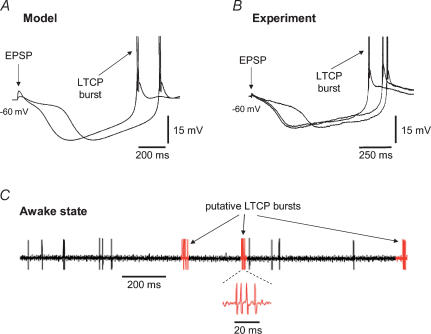
All three forms of recombinant low voltage-activated T-type Ca(2)(+) channels (Ca(v)3.1, Ca(v)3.2 and Ca(v)3.3) exhibit a small, though clearly evident, window T-type Ca(2)(+) current (I(Twindow)) which is also present in native channels from different neuronal types. In thalamocortical (TC) and nucleus reticularis thalami (NRT) neurones, and possibly in neocortical cells, an I(Twindow)-mediated bistability is the key cellular mechanism underlying the expression of the slow (< 1 Hz) sleep oscillation, one of the fundamental EEG rhythms of non-REM sleep. As the I(Twindow)-mediated bistability may also represent one of the cellular mechanisms underlying the expression of high frequency burst firing in awake conditions, I(Twindow) is of critical importance in neuronal population dynamics associated with different behavioural states.


Figures

Figure 1
Figure 1. Biophysics of ITwindow-mediated bistability and its demonstration in TC neurones
Aa, steady-state activation and inactivation curves of IT from a TC neurone in vitro, showing in grey the region of overlap, i.e. the basis for ITwindow. b, plot of the absolute value of ITwindow (bell-shaped curve) and two Ileaks (blue and green lines). c, net current–voltage plot for the colour coded conditions depicted in b: bistability, i.e. two stable membrane potentials (filled and open circle), is present for the green but not for the blue line. d, plot of the small Ileak as in b and a small ITwindow (red curve) shows only one point of intersection. e, plot of the small Ileak and ITwindow as in d, but with two steady inward currents (continuous and dashed purple lines). f, net current–voltage plot for the colour coded conditions depicted in d and e: bistability is absent when IT is small (red line), but can be reintroduced by addition of a steady inward current that shifts the curve downwards (continuous purple line). A larger inward current further shifts the curve downwards with a loss of bistability and an instatement of a more depolarized membrane potential (open circle on dashed purple line). B, steady-state activation and inactivation curves for recombinant Cav3.1, Cav3.2 and Cav3.3 channels (a), and corresponding window currents (b). C, bistability is observed in TC neurones when Ih is blocked with ZD 7288. The transition from one to the other resting potential is achived by intracellular injection of current pulses. Da, following the block of IT with Ni2+, bistability is reintroduced in this TC neurone by using an amount of computer-generated IT commensurate with the theoretical prediction (i.e. the unfilled and filled circles of the green line in the voltage-net current plot match the two experimentally measured resting membrane potentials). A decrease in artificial gT to 140 nS (bottom records) abolishes the bistability as the voltage–net current plot now has only one resting membrane potential (filled circle of red line), as shown in Ab and Ad. However, using the same gT, bistability is reintroduced by the addition of a steady direct current (continuous purple line), as shown in Ae and Af. B used from Perez-Reyes, (2003) with permission (© 2003, American Physiological Society).
Figure 2
Figure 2. ITwindow-mediated bistability is the key cellular mechanism of the slow (< 1 Hz) sleep oscillation in TC and NRT neurones
A, bistability in computer simulations using a TC neurone model containing only IT and Ileak (upper trace). Note the similarity of the waveform to the experimental records in Fig. 1C. Addition of Ih leads to a continuous oscillation of the membrane potential (middle trace), the period of which is drastically affected by the further addition of ICAN to the model (lower trace). B, similarities of the slow (< 1 Hz) sleep oscillation observed in vitro and in vivo (the latter recorded simultaneously with the slow (< 1 Hz) rhythm in the EEG. C, in every TC neurone in vitro, the non-selective mGluR agonist (+/−)-1-aminocyclopentane-trans-1,3-dicarboxylic acid (trans-ACPD) elicits the slow (< 1 Hz) sleep oscillation, which is unaffected by the selective mGluR5 antagonist 2-methyl-G-(phenylethynyl) pyridine (MPEP), but blocked by the selective mGluR1a antagonist LY367385. D, block of the slow (< 1 Hz) sleep oscillation by Ni2+ but not by Cd2+. Downward deflections in the lowermost record are the neurone response to hyperpolarizing current pulses. E, the slow (< 1Hz) sleep oscillation recorded in an NRT neurone in vitro. B from contreras & Steriade (1995) with permission (© 1995 by the Society for Neuroscience). C and D from Sherman et al. (2001) with permission (© 2002, Elsevier).
Figure 3
Figure 3. Summary of the ITwindow-mediated cellular mechanism of the slow (< 1 Hz) sleep oscillation in TC neurones
Figure 4
Figure 4. The ITwindow-mediated bistable system may be responsible for high frequency burst firing in TC neurones during the awake state
A, computer simulations showing how at −60 mV two small EPSPs can evoke the stereotypical ITwindow-mediated response, consisting of a large hyperpolarization followed by an LTCP and high frequency firing. B, the same sequence of events as in A can be recorded in vitro in TC neurones. C, extracellular activity from a TC neurone of an awake behaving monkey showing high frequency bursts with putative characteristics of an LTCP-mediated event. C from Sherman (2001) with permission (© 2001, Elsevier).

References

    1. Achermann P, Borbely AA. Low-frequency (< 1 Hz) oscillations in the human sleep electroencephalogram. Neuroscience. 1997;81:213–222. - PubMed
    1. Amzica F, Steriade M. The K-complex: its slow (<1-Hz) rhythmicity and relation to delta waves. Neurology. 1997;49:952–959. - PubMed
    1. Blethyn KL, Hughes SW, Cope DW, Crunelli V. Nucleus-specific properties of the slow (<1 hz) oscillation in thalamic neurones in vitro. Soc Neurosci Abstr. 2002;28(352.4)
    1. Blethyn KL, Hughes SW, Cope DW, Crunelli V. The role of ionic conductances underlying a slow (<1 hz) oscillation in neurones of the thalamic reticular nucleus in vitro. Soc Neurosci Abstr. 2003;29(699.3)
    1. Carbone E, Lux HD. A low voltage-activated, fully inactivating Ca channel in vertebrate sensory neurones. Nature. 1984;310:501–502. - PubMed

Publication types

Substances