Innate immunity in Arabidopsis thaliana: lipopolysaccharides activate nitric oxide synthase (NOS) and induce defense genes
- PMID: 15498873
- PMCID: PMC524824
- DOI: 10.1073/pnas.0404536101
Innate immunity in Arabidopsis thaliana: lipopolysaccharides activate nitric oxide synthase (NOS) and induce defense genes
Abstract
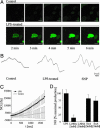
Lipopolysaccharides (LPS) are cell-surface components of Gram-negative bacteria and are microbe-/pathogen-associated molecular patterns in animal pathosystems. As for plants, the molecular mechanisms of signal transduction in response to LPS are not known. Here, we show that Arabidopsis thaliana reacts to LPS with a rapid burst of NO, a hallmark of innate immunity in animals. Fifteen LPS preparations (among them Burkholderia cepacia, Pseudomonas aeruginosa, and Erwinia carotovora) as well as lipoteichoic acid from Gram-positive Staphylococcus aureus were found to trigger NO production in suspension-cultured Arabidopsis cells as well as in leaves. NO was detected by confocal laser-scanning microscopy in conjunction with the fluorophore 4-amino-5-methylamino-2',7'-difluorofluorescein diacetate, by electron paramagnetic resonance, and by a NO synthase (NOS) assay. The source of NO was addressed by using T-DNA insertion lines. Interestingly, LPS did not activate the pathogen-inducible varP NOS, but AtNOS1, a distinct NOS previously associated with hormonal signaling in plants. A prominent feature of LPS treatment was activation of defense genes, which proved to be mediated by NO. Northern analyses and transcription profiling by using DNA microarrays revealed induction of defense-associated genes both locally and systemically. Finally, AtNOS1 mutants showed dramatic susceptibility to the pathogen Pseudomonas syringae pv. tomato DC3000. In sum, perception of LPS and induction of NOS contribute toward the activation of plant defense responses.
Figures


Similar articles
-
Distinct carbohydrate and lipid-based molecular patterns within lipopolysaccharides from Burkholderia cepacia contribute to defense-associated differential gene expression in Arabidopsis thaliana.Innate Immun. 2012 Feb;18(1):140-54. doi: 10.1177/1753425910392609. Epub 2011 Jul 6. Innate Immun. 2012. PMID: 21733976
-
Nitric oxide-mediated maintenance of redox homeostasis contributes to NPR1-dependent plant innate immunity triggered by lipopolysaccharides.Plant Physiol. 2012 Oct;160(2):1081-96. doi: 10.1104/pp.112.201798. Epub 2012 Aug 27. Plant Physiol. 2012. PMID: 22926319 Free PMC article.
-
Nitrite as the major source of nitric oxide production by Arabidopsis thaliana in response to Pseudomonas syringae.FEBS Lett. 2005 Jul 4;579(17):3814-20. doi: 10.1016/j.febslet.2005.05.078. FEBS Lett. 2005. PMID: 15978583
-
Hunting for plant nitric oxide synthase provides new evidence of a central role for plastids in nitric oxide metabolism.Plant Cell. 2009 Jan;21(1):18-23. doi: 10.1105/tpc.108.065243. Epub 2009 Jan 23. Plant Cell. 2009. PMID: 19168714 Free PMC article. Review.
-
The complexity of disease signaling in Arabidopsis.Curr Opin Immunol. 2001 Feb;13(1):63-8. doi: 10.1016/s0952-7915(00)00183-7. Curr Opin Immunol. 2001. PMID: 11154919 Review.
Cited by
-
Dual Roles of GSNOR1 in Cell Death and Immunity in Tetraploid Nicotiana tabacum.Front Plant Sci. 2021 Feb 10;12:596234. doi: 10.3389/fpls.2021.596234. eCollection 2021. Front Plant Sci. 2021. PMID: 33643341 Free PMC article.
-
Identification of MAMP-Responsive Plasma Membrane-Associated Proteins in Arabidopsis thaliana Following Challenge with Different LPS Chemotypes from Xanthomonas campestris.Pathogens. 2020 Sep 25;9(10):787. doi: 10.3390/pathogens9100787. Pathogens. 2020. PMID: 32992883 Free PMC article.
-
The Lipopolysaccharide-Induced Metabolome Signature in Arabidopsis thaliana Reveals Dynamic Reprogramming of Phytoalexin and Phytoanticipin Pathways.PLoS One. 2016 Sep 22;11(9):e0163572. doi: 10.1371/journal.pone.0163572. eCollection 2016. PLoS One. 2016. PMID: 27656890 Free PMC article.
-
Insight into Types I and II nonhost resistance using expression patterns of defense-related genes in tobacco.Planta. 2006 Apr;223(5):1101-7. doi: 10.1007/s00425-006-0232-1. Epub 2006 Feb 16. Planta. 2006. PMID: 16482435
-
Regulation of plant glycine decarboxylase by s-nitrosylation and glutathionylation.Plant Physiol. 2010 Mar;152(3):1514-28. doi: 10.1104/pp.109.152579. Epub 2010 Jan 20. Plant Physiol. 2010. PMID: 20089767 Free PMC article.
References
-
- Cohn, J., Sessa, G. & Martin, G. B. (2001) Curr. Opin. Immunol. 13, 55-62. - PubMed
-
- Nurnberger, T. & Scheel, D. (2001) Trends Plant Sci. 6, 372-379. - PubMed
-
- Flor, H. H. (1971) Annu. Rev. Phytopathol. 9, 275-296.
-
- Dangl, J. L. & Jones, J. D. (2001) Nature 411, 826-833. - PubMed
-
- Medzhitov, R. & Janeway, C. A., Jr. (2002) Science 296, 298-300. - PubMed
Publication types
MeSH terms
Substances
LinkOut - more resources
Full Text Sources
Other Literature Sources
Molecular Biology Databases
Research Materials

