

A novel model of sensitization and oral tolerance to peanut protein
- PMID: 15500615
- PMCID: PMC1782583
- DOI: 10.1111/j.1365-2567.2004.01989.x
A novel model of sensitization and oral tolerance to peanut protein
Abstract
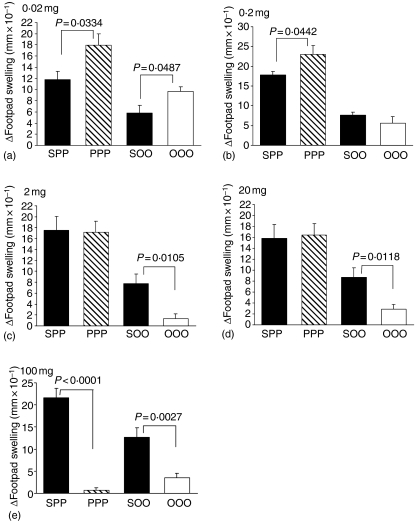
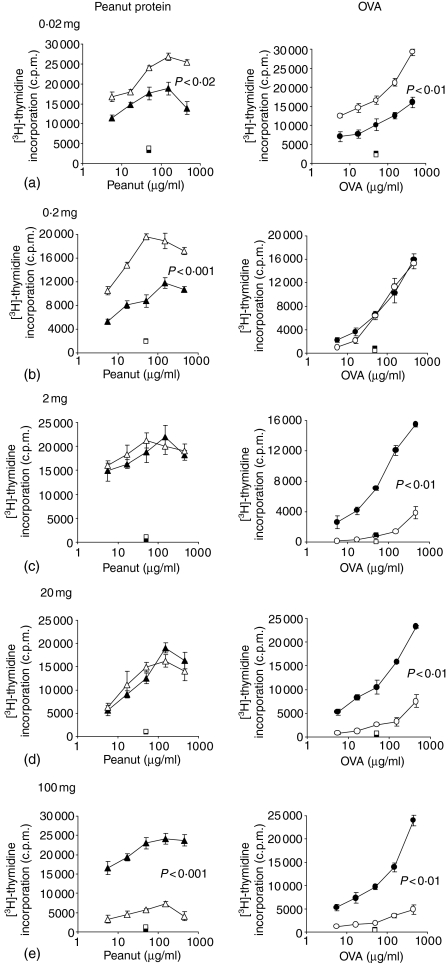
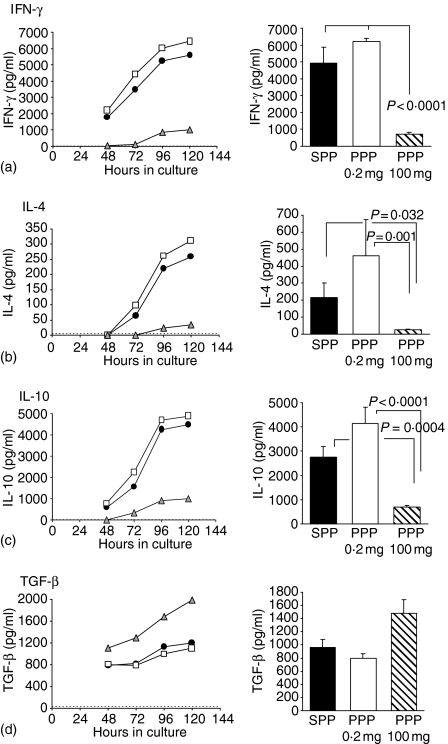
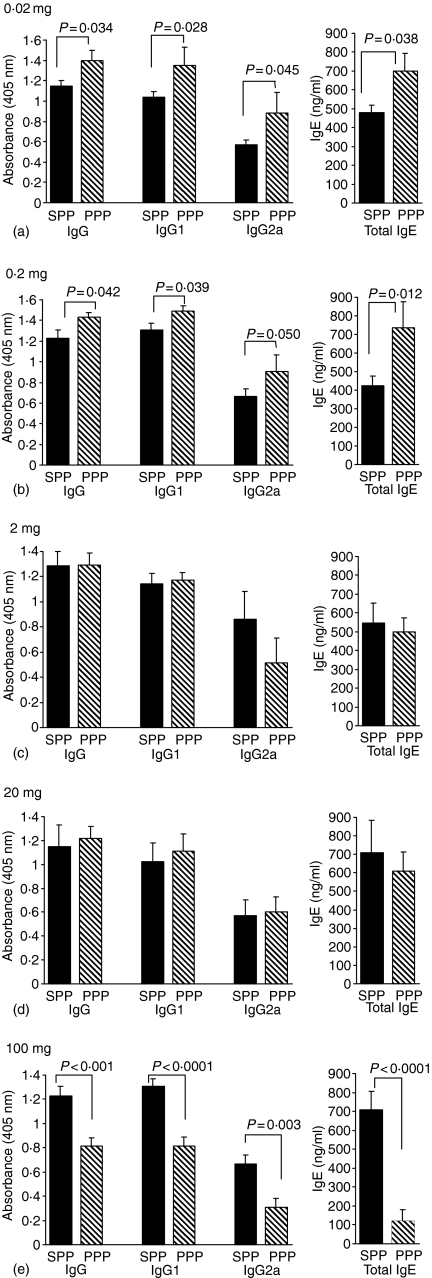
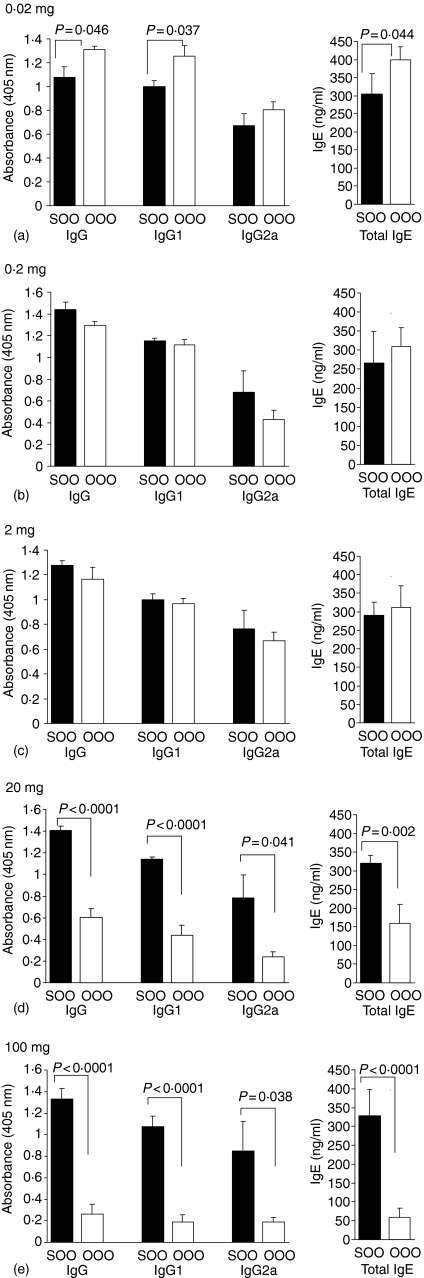
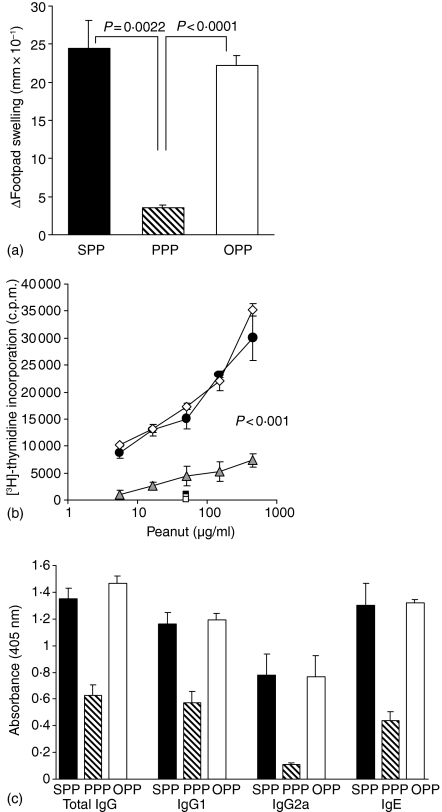
The prevalence of food allergic diseases is rising and poses an increasing clinical problem. Peanut allergy affects around 1% of the population and is a common food allergy associated with severe clinical manifestations. The exact route of primary sensitization is unknown although the gastrointestinal immune system is likely to play an important role. Exposure of the gastrointestinal tract to soluble antigens normally leads to a state of antigen-specific systemic hyporesponsiveness (oral tolerance). A deviation from this process is thought to be responsible for food-allergic diseases. In this study, we have developed a murine model to investigate immunoregulatory processes after ingestion of peanut protein and compared this to a model of oral tolerance to chicken egg ovalbumin (OVA). We demonstrate that oral tolerance induction is highly dose dependent and differs for the allergenic proteins peanut and OVA. Tolerance to peanut requires a significantly higher oral dose than tolerance to OVA. Low doses of peanut are more likely to induce oral sensitization and increased production of interleukin-4 and specific immunoglobulin E upon challenge. When tolerance is induced both T helper 1 and 2 responses are suppressed. These results show that oral tolerance to peanut can be induced experimentally but that peanut proteins have a potent sensitizing effect. This model can now be used to define regulatory mechanisms following oral exposure to allergenic proteins on local, mucosal and systemic immunity and to investigate the immunomodulating effects of non-oral routes of allergen exposure on the development of allergic sensitization to peanut and other food allergens.
Figures
Similar articles
-
Epicutaneous exposure to peanut protein prevents oral tolerance and enhances allergic sensitization.Clin Exp Allergy. 2005 Jun;35(6):757-66. doi: 10.1111/j.1365-2222.2005.02260.x. Clin Exp Allergy. 2005. PMID: 15969667
-
Prevention of oral food allergy sensitization via skin application of food allergen in a mouse model.Allergy. 2012 May;67(5):622-9. doi: 10.1111/j.1398-9995.2012.02798.x. Epub 2012 Feb 17. Allergy. 2012. PMID: 22339388
-
Mixed antibody and T cell responses to peanut and the peanut allergens Ara h 1, Ara h 2, Ara h 3 and Ara h 6 in an oral sensitization model.Clin Exp Allergy. 2004 Sep;34(9):1422-8. doi: 10.1111/j.1365-2222.2004.02062.x. Clin Exp Allergy. 2004. PMID: 15347376
-
Allergy to peanut oil--clinically relevant?J Eur Acad Dermatol Venereol. 2007 Apr;21(4):452-5. doi: 10.1111/j.1468-3083.2006.02133.x. J Eur Acad Dermatol Venereol. 2007. PMID: 17373969 Review.
-
Current opinion and review on peanut oral immunotherapy.Hum Vaccin Immunother. 2014;10(10):3017-21. doi: 10.4161/hv.32190. Hum Vaccin Immunother. 2014. PMID: 25483680 Free PMC article. Review.
Cited by
-
Intact skin and not stripped skin is crucial for the safety and efficacy of peanut epicutaneous immunotherapy (EPIT) in mice.Clin Transl Allergy. 2012 Nov 12;2(1):22. doi: 10.1186/2045-7022-2-22. Clin Transl Allergy. 2012. PMID: 23140259 Free PMC article.
-
Atopic Dermatitis: Early Treatment in Children.Curr Treat Options Allergy. 2017 Sep;4(3):355-369. doi: 10.1007/s40521-017-0140-6. Epub 2017 Aug 1. Curr Treat Options Allergy. 2017. PMID: 29868331 Free PMC article.
-
A histomorphometric classification system for normal and inflamed mouse duodenum-Quali-quantitative approach.Int J Exp Pathol. 2018 Aug;99(4):189-198. doi: 10.1111/iep.12286. Epub 2018 Sep 2. Int J Exp Pathol. 2018. PMID: 30175413 Free PMC article.
-
Peanut applied to the skin of nonhuman primates induces antigen-specific IgG but not IgE.Immun Inflamm Dis. 2020 Jun;8(2):211-215. doi: 10.1002/iid3.296. Epub 2020 Mar 27. Immun Inflamm Dis. 2020. PMID: 32220059 Free PMC article.
-
The renaissance of oral tolerance: merging tradition and new insights.Nat Rev Immunol. 2025 Jan;25(1):42-56. doi: 10.1038/s41577-024-01077-7. Epub 2024 Sep 6. Nat Rev Immunol. 2025. PMID: 39242920 Review.
References
-
- Strobel S, Mowat AM. Immune responses to dietary antigens: oral tolerance. Immunol Today. 1998;19:173–81. - PubMed
-
- Sicherer SH, Munoz-Furlong A, Sampson HA. Prevalence of peanut and tree nut allergy in the United States determined by means of a random digit dial telephone survey: a 5-year follow-up study. J Allergy Clin Immunol. 2003;112:1203–7. - PubMed
-
- Kagan RS, Joseph L, Dufresne C, Gray-Donald K, Turnbull E, Pierre YS, Clarke AE. Prevalence of peanut allergy in primary-school children in Montreal, Canada. J Allergy Clin Immunol. 2003;112:1223–8. - PubMed
-
- Grundy J, Matthews S, Bateman B, Dean T, Arshad SH. Rising prevalence of allergy to peanut in children: Data from 2 sequential cohorts. J Allergy Clin Immunol. 2002;110:784–9. - PubMed
-
- Bock SA, Munoz-Furlong A, Sampson HA. Fatalities due to anaphylactic reactions to foods. J Allergy Clin Immunol. 2001;107:191–3. - PubMed
Publication types
MeSH terms
Substances
LinkOut - more resources
Full Text Sources
Medical