Heterogeneous expression of apolipoprotein-E by human macrophages
- PMID: 15500620
- PMCID: PMC1782582
- DOI: 10.1111/j.1365-2567.2004.01972.x
Heterogeneous expression of apolipoprotein-E by human macrophages
Abstract
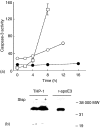
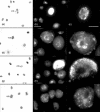
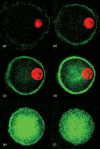
Apolipoprotein-E (apoE) is expressed at high levels by macrophages. In addition to its role in lipid transport, macrophage-derived apoE plays an important role in immunoregulation. Previous studies have identified macrophage subpopulations that differ substantially in their ability to synthesize specific cytokines and enzymes, however, potential heterogeneous macrophage apoE expression has not been studied. Here we examined apoE expression in human THP-1 macrophages and monocyte-derived macrophages (MDM). Using immunocytochemistry and flow cytometry methods we reveal a striking heterogeneity in macrophage apoE expression in both cell types. In phorbol-ester-differentiated THP-1 macrophages, 5% of the cells over-expressed apoE at levels more than 50-fold higher than the rest of the population. ApoE over-expressing THP-1 macrophages contained condensed/fragmented nuclei and increased levels of activated caspase-3 indicating induction of apoptosis. In MDM, 3-5% of the cells also highly over-expressed apoE, up to 50-fold higher than the rest of the population; however, this was not associated with obvious nuclear alterations. The apoE over-expressing MDM were larger, more granular, and more autofluorescent than the majority of cells and they contained numerous vesicle-like structures that appeared to be coated by apoE. Flow cytometry experiments indicated that the apoE over-expressing subpopulation of MDM were positive for CD14, CD11b/Mac-1 and CD68. These observations suggest that specific macrophage subpopulations may be important for apoE-mediated immunoregulation and clearly indicate that subpopulation heterogeneity should be taken into account when investigating macrophage apoE expression.
Figures


Similar articles
-
De novo expression of the class-A macrophage scavenger receptor conferring resistance to apoptosis in differentiated human THP-1 monocytic cells.Cell Death Differ. 1999 Mar;6(3):245-55. doi: 10.1038/sj.cdd.4400485. Cell Death Differ. 1999. PMID: 10200575
-
Krüppel-like factor 4 synergizes with CREB to increase the activity of apolipoprotein E gene promoter in macrophages.Biochem Biophys Res Commun. 2015 Dec 4-11;468(1-2):66-72. doi: 10.1016/j.bbrc.2015.10.163. Epub 2015 Nov 4. Biochem Biophys Res Commun. 2015. PMID: 26546821
-
Apolipoprotein A-I stimulates cholesteryl ester transfer protein and apolipoprotein E secretion from lipid-loaded macrophages; the role of NF-κB and PKA signaling pathways.Biochem Biophys Res Commun. 2011 Nov 25;415(3):497-502. doi: 10.1016/j.bbrc.2011.10.101. Epub 2011 Oct 28. Biochem Biophys Res Commun. 2011. PMID: 22056562
-
Phenotype-dependent differences in apolipoprotein E metabolism and in cholesterol homeostasis in human monocyte-derived macrophages.J Clin Invest. 1998 Apr 15;101(8):1670-7. doi: 10.1172/JCI119887. J Clin Invest. 1998. PMID: 9541497 Free PMC article.
-
The cell and molecular biology of apolipoprotein E synthesis by macrophages.Ciba Found Symp. 1986;118:155-71. doi: 10.1002/9780470720998.ch11. Ciba Found Symp. 1986. PMID: 3525037 Review.
Cited by
-
Loss of synovial tissue macrophage homeostasis precedes rheumatoid arthritis clinical onset.Sci Adv. 2024 Sep 27;10(39):eadj1252. doi: 10.1126/sciadv.adj1252. Epub 2024 Sep 25. Sci Adv. 2024. PMID: 39321281 Free PMC article.
-
Macrophage Apoptosis and Efferocytosis in the Pathogenesis of Atherosclerosis.Circ J. 2016 Oct 25;80(11):2259-2268. doi: 10.1253/circj.CJ-16-0924. Epub 2016 Oct 8. Circ J. 2016. PMID: 27725526 Free PMC article. Review.
-
Macrophage LRP-1 controls plaque cellularity by regulating efferocytosis and Akt activation.Arterioscler Thromb Vasc Biol. 2010 Apr;30(4):787-95. doi: 10.1161/ATVBAHA.109.202051. Epub 2010 Feb 11. Arterioscler Thromb Vasc Biol. 2010. PMID: 20150557 Free PMC article.
-
Exploring the Challenges of Lipid Nanoparticle Development: The In Vitro-In Vivo Correlation Gap.Vaccines (Basel). 2025 Mar 21;13(4):339. doi: 10.3390/vaccines13040339. Vaccines (Basel). 2025. PMID: 40333261 Free PMC article.
-
Cell-specific production, secretion, and function of apolipoprotein E.J Mol Med (Berl). 2018 May;96(5):361-371. doi: 10.1007/s00109-018-1632-y. Epub 2018 Mar 7. J Mol Med (Berl). 2018. PMID: 29516132 Review.
References
-
- Mahley RW. Apolipoprotein E. cholesterol transport protein with expanding role in cell biology. Science. 1988;240:622. - PubMed
-
- Basu SK, Ho YK, Brown MS, Bilheimer DW, Anderson RG, Goldstein JL. Biochemical and genetic studies of the apoprotein E secreted by mouse macrophages and human monocytes. J Biol Chem. 1982;257:9788. - PubMed
-
- Werb Z, Chin JR, Takemura R, Oropeza RL, Bainton DF, Stenberg P, Taylor JM, Reardon C. The cell and molecular biology of apolipoprotein E synthesis by macrophages. Ciba Found Symp. 1986;118:155. - PubMed
-
- Curtiss LK, Forte TM, Davis PA. Cord blood plasma lipoproteins inhibit mitogen-stimulated lymphocyte proliferation. J Immunol. 1984;133:1379. - PubMed
-
- Pepe MG, Curtiss LK. Apolipoprotein E is a biologically active constituent of the normal immunoregulatory lipoprotein, LDL-In. J Immunol. 1986;136:3716. - PubMed
Publication types
MeSH terms
Substances
LinkOut - more resources
Full Text Sources
Research Materials
Miscellaneous
