

doi: 10.1128/IAI.72.11.6733-6737.2004.
In vitro and in vivo evaluation of staphylococcal superantigen peptide antagonists
Affiliations
- PMID: 15501813
- PMCID: PMC522998
- DOI: 10.1128/IAI.72.11.6733-6737.2004
Item in Clipboard
In vitro and in vivo evaluation of staphylococcal superantigen peptide antagonists
Infect Immun.
2004 Nov.
Abstract
Superantigen peptide antagonists failed to block T-cell activation and cytokine production as well as toxic shock induced by staphylococcal enterotoxin B (SEB) in HLA class II transgenic mice. They also failed to inhibit the binding of SEB to HLA class II molecules as well as activation of human T lymphocytes in vitro.
Figures
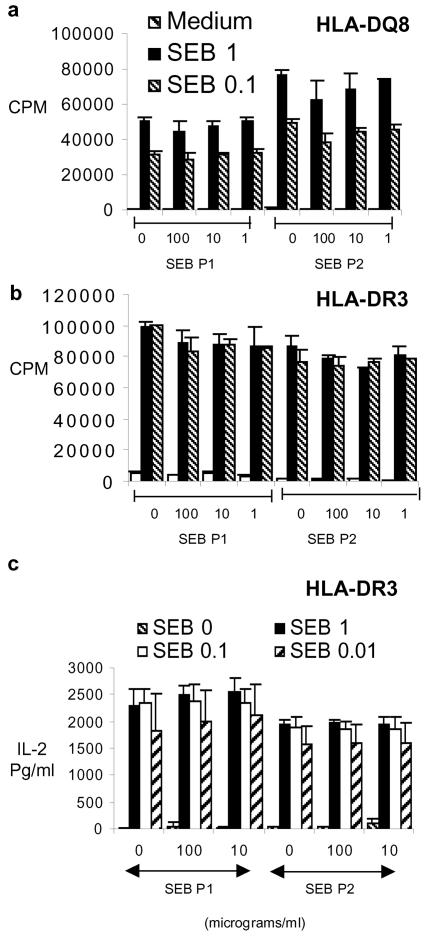
Single-cell suspensions of splenocytes from HLA-DQ8 (a) and HLA-DR3 (b and c) transgenic mice were cultured for 48 h in the presence of medium alone or various concentrations of SEB. SEB antagonistic peptides were also added at the indicated concentrations. (a and b) Splenocyte proliferation, as determined by measuring tritiated-thymidine uptake. (c) Interleukin-2 (IL-2) production in vitro by splenocytes from HLA-DR3 transgenic mice, as measured by sandwich enzyme-linked immunosorbent assay. Each bar represents the mean ± standard error from at least four independent experiments.
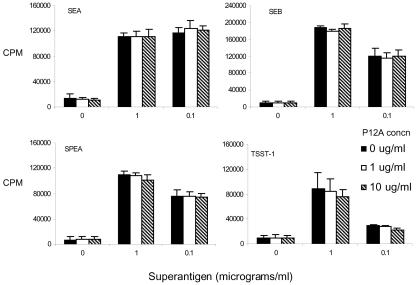
Single-cell suspensions of splenocytes from HLA-DQ8 transgenic mice were cultured for 48 h in the presence of medium alone or various concentrations of the indicated SAg. SEB P12A was added at the indicated concentrations. Cell proliferation was determined by measuring tritiated-thymidine uptake. Each bar represents the mean ± standard error from at least four independent experiments.
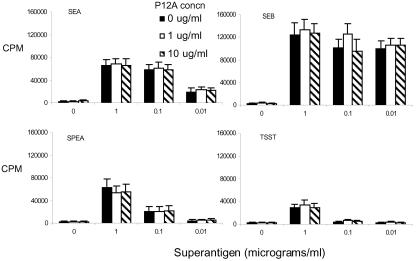
Single-cell suspensions of splenocytes from HLA-DR3 transgenic mice were cultured for 48 h in the presence of medium alone or various concentrations of the indicated SAg. SEB P12A was added at the indicated concentrations. Cell proliferation was determined by measuring tritiated-thymidine uptake. Each bar represents the mean ± standard error. Representative data from two of the four independent but similar experiments are given.
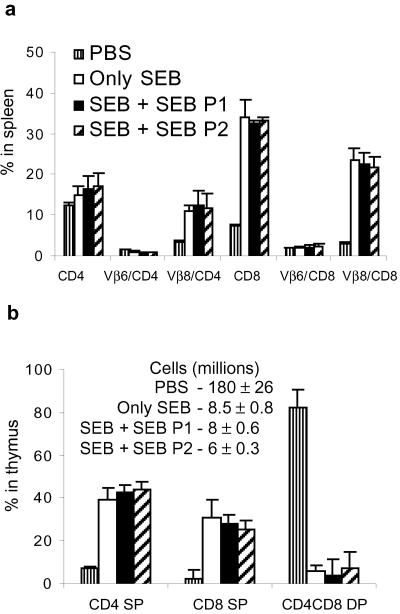
HLA-DR3 transgenic mice were challenged with a single (10-μg) dose of SEB. Simultaneously, they also received 100 μg of either SEB P1 or SEB P2 or PBS alone. Mice were sacrificed 3 days later, and the distributions of various T-cell subsets in spleen (a) and thymus (b) were determined by flow cytometry. Numbers indicate the absolute cell counts in thymus. Each bar represents the mean ± standard deviation from at least three mice.
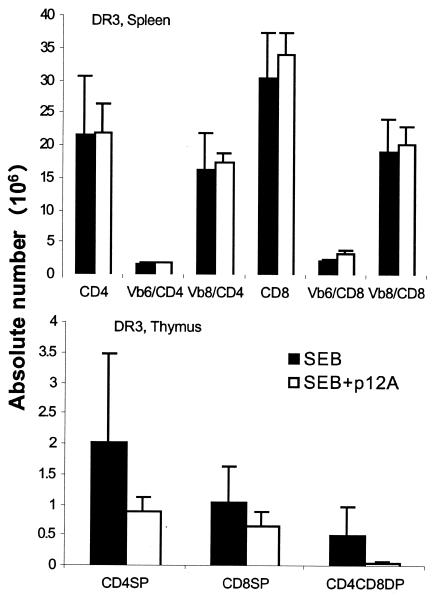
HLA-DR3 transgenic mice were challenged with a single (10-μg) dose of SEB alone or SEB with 100 μg of SEB P12A. Mice were sacrificed 3 days later, and the distributions of various T-cell subsets in spleen (top) and thymus (bottom) were determined by flow cytometry. Each bar represents the mean ± standard deviation from at least four or five mice. SP, single positive.
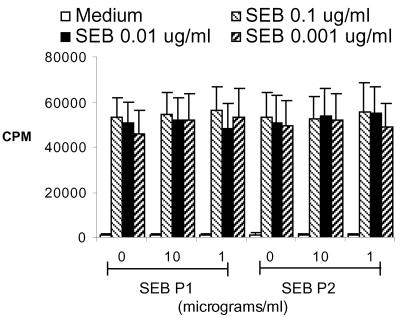
PBMC from healthy individuals were cultured in vitro with the indicated concentrations of SEB along with different concentrations of SEB antagonistic peptides for 48 h. Cell proliferation was determined by measuring thymidine incorporation. Each bar represents the mean ± standard error from at least five different individuals.
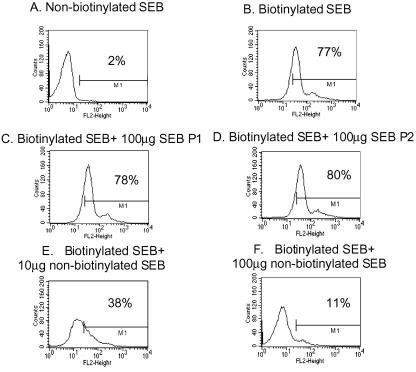
PBMC from healthy individuals were incubated with 10 μg of nonbiotinylated SEB (A) or 10 μg of biotinylated SEB (B to F) along with the indicated concentrations of SEB P1 (C) or SEB P2 (D) or nonbiotinylated SEB (E and F). The extent of SEB binding to cells was determined by using avidin-labeled phycoerythrin for flow cytometry. Representative data from two similar experiments are given.
Similar articles
-
Expression and function of HLA-DR3 and DQ8 in transgenic mice lacking functional H2-M.Tissue Antigens. 2003 Aug;62(2):149-61. doi: 10.1034/j.1399-0039.2003.00088.x. Tissue Antigens. 2003. PMID: 12889995
-
Major histocompatibility complex class II-associated peptides determine the binding of the superantigen toxic shock syndrome toxin-1.Eur J Immunol. 1995 Oct;25(10):2894-8. doi: 10.1002/eji.1830251028. Eur J Immunol. 1995. PMID: 7589089
-
Human CD4 and human major histocompatibility complex class II (DQ6) transgenic mice: supersensitivity to superantigen-induced septic shock.Eur J Immunol. 1996 May;26(5):1074-82. doi: 10.1002/eji.1830260518. Eur J Immunol. 1996. PMID: 8647170
-
Chemotherapeutics targeting immune activation by staphylococcal superantigens.Med Sci Monit. 2005 Sep;11(9):RA290-5. Epub 2005 Aug 26. Med Sci Monit. 2005. PMID: 16127375 Review.
-
PI3K/Akt/mTOR, a pathway less recognized for staphylococcal superantigen-induced toxicity.Toxins (Basel). 2012 Nov 15;4(11):1343-66. doi: 10.3390/toxins4111343. Toxins (Basel). 2012. PMID: 23202320 Free PMC article. Review.
Cited by
-
Endogenous HLA-DQ8αβ programs superantigens (SEG/SEI) to silence toxicity and unleash a tumoricidal network with long-term melanoma survival.J Immunother Cancer. 2020 Oct;8(2):e001493. doi: 10.1136/jitc-2020-001493. J Immunother Cancer. 2020. PMID: 33109631 Free PMC article.
-
Therapeutic down-modulators of staphylococcal superantigen-induced inflammation and toxic shock.Toxins (Basel). 2010 Aug;2(8):1963-83. doi: 10.3390/toxins2081963. Epub 2010 Jul 29. Toxins (Basel). 2010. PMID: 22069668 Free PMC article. Review.
-
Update on staphylococcal superantigen-induced signaling pathways and therapeutic interventions.Toxins (Basel). 2013 Sep 24;5(9):1629-54. doi: 10.3390/toxins5091629. Toxins (Basel). 2013. PMID: 24064719 Free PMC article. Review.
-
Human leukocyte antigen class II transgenic mouse model unmasks the significant extrahepatic pathology in toxic shock syndrome.Am J Pathol. 2011 Jun;178(6):2760-73. doi: 10.1016/j.ajpath.2011.02.033. Am J Pathol. 2011. PMID: 21641398 Free PMC article.
-
Intranasal exposure to bacterial superantigens induces airway inflammation in HLA class II transgenic mice.Infect Immun. 2006 Feb;74(2):1284-96. doi: 10.1128/IAI.74.2.1284-1296.2006. Infect Immun. 2006. PMID: 16428778 Free PMC article.
References
-
- Arad, G., D. Hillman, R. Levy, and R. Kaempfer. 2004. Broad-spectrum immunity against superantigens is elicited in mice protected from lethal shock by a superantigen antagonist peptide. Immunol. Lett. 91:141-145. - PubMed
-
- Arad, G., D. Hillman, R. Levy, and R. Kaempfer. 2001. Superantigen antagonist blocks Th1 cytokine gene induction and lethal shock. J. Leukoc. Biol. 69:921-927. - PubMed
-
- Arad, G., R. Levy, D. Hillman, and R. Kaempfer. 2000. Superantigen antagonist protects against lethal shock and defines a new domain for T-cell activation. Nat. Med. 6:414-421. - PubMed
-
- DaSilva, L., B. C. Welcher, R. G. Ulrich, M. J. Aman, C. S. David, and S. Bavari. 2002. Humanlike immune response of human leukocyte antigen-DR3 transgenic mice to staphylococcal enterotoxins: a novel model for superantigen vaccines. J. Infect. Dis. 185:1754-1760. - PubMed
-
- Hong-Geller, E., and G. Gupta. 2003. Therapeutic approaches to superantigen-based diseases: a review. J. Mol Recognit. 16:91-101. - PubMed
Publication types
MeSH terms
Substances
Grants and funding
LinkOut - more resources
Full Text Sources
Research Materials
