. 2005 Jan;88(1):579-89.
doi: 10.1529/biophysj.104.048827. Epub 2004 Oct 22.

Quantitative imaging of lymphocyte membrane protein reorganization and signaling

Affiliations

Quantitative imaging of lymphocyte membrane protein reorganization and signaling

Peter M Kasson et al. Biophys J. 2005 Jan.

Abstract

Changes in membrane protein localization are critical to establishing cell polarity and regulating cell signaling. Fluorescence microscopy of labeled proteins allows visualization of these changes, but quantitative analysis is needed to study this aspect of cell signaling in full mechanistic detail. We have developed a novel approach for quantitative assessment of membrane protein redistribution based on four-dimensional video microscopy of fluorescently labeled proteins. Our analytic system provides robust automated methods for cell surface reconstruction, cell shape tracking, cell-surface distance measurement, and cluster formation analysis. These methods permit statistical analyses and testing of mechanistic hypotheses regarding cell signaling. We have used this approach to measure antigen-dependent clustering of signaling molecules in CD4+ T lymphocytes, obtaining clustering velocities consistent with single-particle tracking data. Our system captures quantitative differences in clustering between signaling proteins with distinct biological functions. Our methods can be generalized to a range of cell-signaling phenomena and enable novel applications not feasible with single-particle studies, such as analysis of subcellular protein localization in live organ culture.


Figures
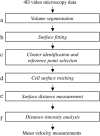
FIGURE 1
FIGURE 1
Analytic process for measuring membrane protein velocities. This schema depicts the stages of cell surface reconstruction, clustering analysis, and alignment performed by our system. (a) The volume segmentation filter serves to detect membrane structures in the image volume. Surface reconstruction performed at stage b uses a level-set method to fit a smooth surface to the membrane data points. (c) Clustering analysis is performed at a single time point to identify the center of the brightest cluster, which will serve as the reference point for further analysis. Cell surface tracking information obtained in stage d is then used to propagate this spatial reference point to all time points. (e) Cell surface distances are measured at each time point by a surface walking technique, using the reference point identified in stage d as the origin. (f) The distance information obtained in stage e is combined with membrane voxel intensity information to yield a distance-intensity distribution for each time point, from which the mean velocity can be calculated.
FIGURE 2
FIGURE 2
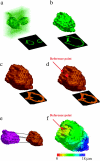
Images from the analysis of a single T-cell volume and renderings shown are from progressive analytic stages of a single time point from a CD3ζ-GFP data set. Each rendering shows the input data to the correspondingly lettered process in Fig. 1. Shown in panel a is the deconvolved microscopy data set. The set of membrane voxels identified by the segmentation filter is shown in panel b, and the reconstructed cell surface is shown in panel c. Shown in panel d is the cell surface with the reference point identified at 90 s after calcium flux, and shown in panel e are two aligned surfaces from the same cell at different time points. Shown in panel f is a distance map of the cell surface. Figure insets show x-y midsections through the cell.
FIGURE 3
FIGURE 3
Radial distribution of intensity. Plotted are distributions showing the relative enrichment of CD3ζ-GFP at each surface distance increment from the reference point. The distribution plotted in panel a is at 1 min before Ca2+ flux, the distribution in panel b is at 0.5 min after Ca2+ flux, and the distribution in panel c is 1.5 min after Ca2+ flux. Mean intensity-distance values are 9.8, 8.4, and 8.1 μm, respectively. Distributions are corrected for the total surface area present at each distance from the reference point (calculated as the fraction of total CD3ζ-GFP present at each distance divided by the fraction of surface area at that distance). The intensity profile shifts from a close approximation of a uniform distribution to one that is substantially skewed toward the reference point, consistent with clustering behavior. Renderings of the cell membrane points selected by our segmentation filter are shown in panels d, e, and f for time points corresponding to the distributions plotted, colored by voxel intensity.
FIGURE 4
FIGURE 4
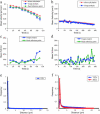
Tests on simulated data. Receptor motion on the cell surface was simulated by modeling a large number of particles undergoing Brownian motion with an attractive drift term. Particle motion was calculated using discrete time steps on the surface of a spheroid with radii 7 and 4.7 μm using the time-evolution equations derived by Brillinger (1997). Voxel occupancies were calculated from particle positions at each time, and the resulting images were processed using our analytic system as if they were observed four-dimensional data. Particle positions were also analyzed directly for use as a reference standard (see text). Clustering with attractive velocity component δ = 0.032 μm/s is plotted in panel a. Clustering with attractive velocity component δ = 0.095 μm/s is plotted in panel b. The mean percentage error introduced by our image analysis system is plotted in panels c and d. In the case of a very punctate distribution, small spatial errors in reference point alignment can result in large percentage errors. The effects of reference point error were also analyzed by fixing the reference point and comparing the percentage error. Histograms in panels e and f show the distribution of particle distances from the reference point in the simulations analyzed in panels a and b. The greater directed motion in panel a results in very punctate clustering of most particles after 2 min (e), whereas the smaller directed motion in panel b results in a smaller punctate clustering component and a more disperse distribution at 2 min, with a more completely clustered (but still less punctate, as can be seen by the difference in peak widths) distribution at 5 min (f). Sixteen simulations were performed for each attractive velocity; all error bars shown represent the first and third quartiles of the data.
FIGURE 5
FIGURE 5
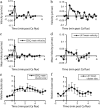
Receptor velocity in response to T-lymphocyte stimulation. (a) CD3ζ velocity measurements derived from bulk fluorescence measurements via our analytic system are plotted for a single cell. (b) A T-cell receptor velocity trace from the average of eight single-particle measurements is plotted using published data (Moss et al., 2002). (c) Shown are CD3ζ mean velocity measurements calculated based on analysis of six cells. (d) Plotted are mean velocity measurements for LAT movement toward the cell-cell interface. Values represent the mean of six cells. (e) Plotted are measurements of local CD3ζ cluster size near the interface. Values represent the mean of six cells. (f) Plotted are measurements of LAT local cluster size near the interface. Values plotted represent the mean of six cells. Both mean velocity and cluster size measurements show rapid LAT cluster formation followed by dissipation over the next 2 min, in contrast to the more stable cluster formation by CD3ζ. As our data are not normally distributed, nonparametric error analysis is used and error bars depict the first and third quartiles of the data in each plot.
FIGURE 6
FIGURE 6
Robustness testing. Robustness of surface reconstruction to missing data is shown in panel a. Missing data were generated by randomly selecting a membrane surface voxel and deleting all voxels within a given radius. Surface reconstruction was performed on the data sets thus generated, and the resulting surface voxels were compared to the unperturbed surface via a closest point matching strategy. The number of matched points (# pts) and the root-mean-squared deviation (rmsd) of matched points are plotted as a function of increasing deletion radius. Surface reconstruction is robust to deletions of as large as 5 μm; larger deletions are unrealistic, as the mean radius of a T lymphocyte is 7 μm. To test the potential biasing effect of cluster analysis for reference point determination, we compare in panel b experimentally observed clustering velocities to those calculated on data sets with randomly permuted intensities. Initial peak receptor velocities for the observed experimental data significantly exceed those in the randomized data (p < 0.01). Error bars represent one standard deviation of the mean. Robustness of cell surface alignment to stepwise perturbation error is plotted in panel c. Root-mean-squared deviation (rmsd) from the unperturbed alignment is plotted as a function of time based on 20 perturbation experiments. Our method is robust to stepwise error of σ ≤ 2 μm. Robustness of cell surface alignment and subsequent velocity measurements to choice of reference point is shown in panel d. The ratio of clustering velocity to standard deviation for each error level is plotted for different error levels σ based on 24 perturbation experiments each.

Similar articles

Cited by

References

    1. Agard, D. A., Y. Hiraoka, P. Shaw, and J. W. Sedat. 1989. Fluorescence microscopy in three dimensions. Methods Cell Biol. 30:353–377. - PubMed
    1. Bajenoff, M., S. Granjeaud, and S. Guerder. 2003. The strategy of T cell antigen-presenting cell encounter in antigen-draining lymph nodes revealed by imaging of initial T cell activation. J. Exp. Med. 198:715–724. - PMC - PubMed
    1. Boldin, M. P., I. L. Mett, E. E. Varfolomeev, I. Chumakov, Y. Shemer-Avni, J. H. Camonis, and D. Wallach. 1995. Self-association of the “death domains” of the p55 tumor necrosis factor (TNF) receptor and Fas/APO1 prompts signaling for TNF and Fas/APO1 effects. J. Biol. Chem. 270:387–391. - PubMed
    1. Bousso, P., N. R. Bhakta, R. S. Lewis, and E. Robey. 2002. Dynamics of thymocyte-stromal cell interactions visualized by two-photon microscopy. Science. 296:1876–1880. - PubMed
    1. Brillinger, D. R. 1997. A particle migrating randomly on a sphere. J. Theor. Probab. 10:429–443.

Publication types

MeSH terms