. 2005 Jan;88(1):211-23.
doi: 10.1529/biophysj.104.051714. Epub 2004 Oct 22.

FPL 64176 modification of Ca(V)1.2 L-type calcium channels: dissociation of effects on ionic current and gating current

Affiliations

FPL 64176 modification of Ca(V)1.2 L-type calcium channels: dissociation of effects on ionic current and gating current

Stefan I McDonough et al. Biophys J. 2005 Jan.

Abstract

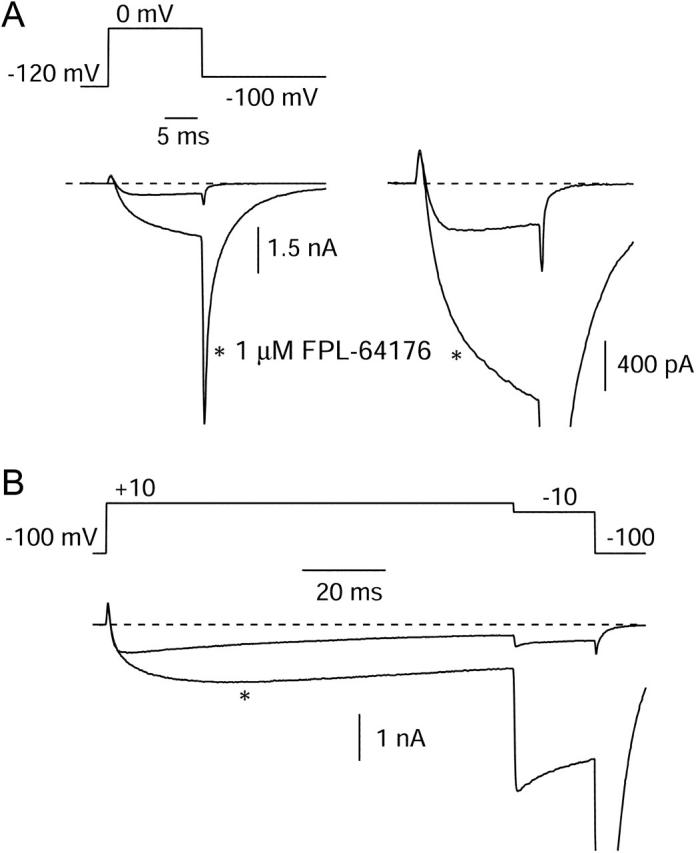
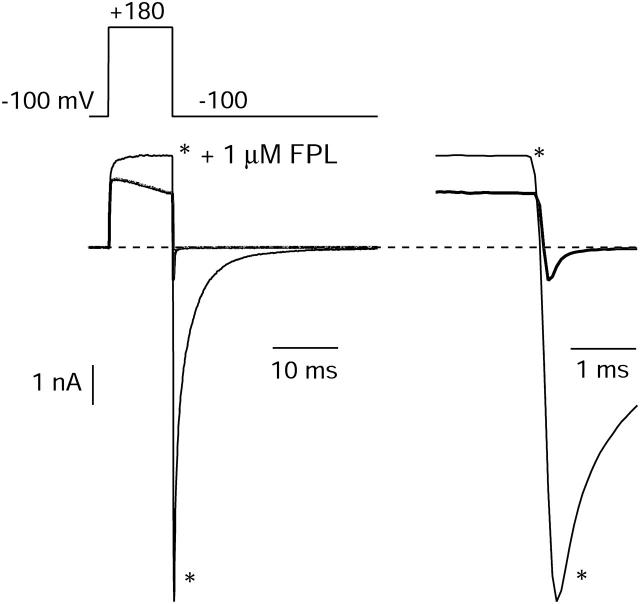
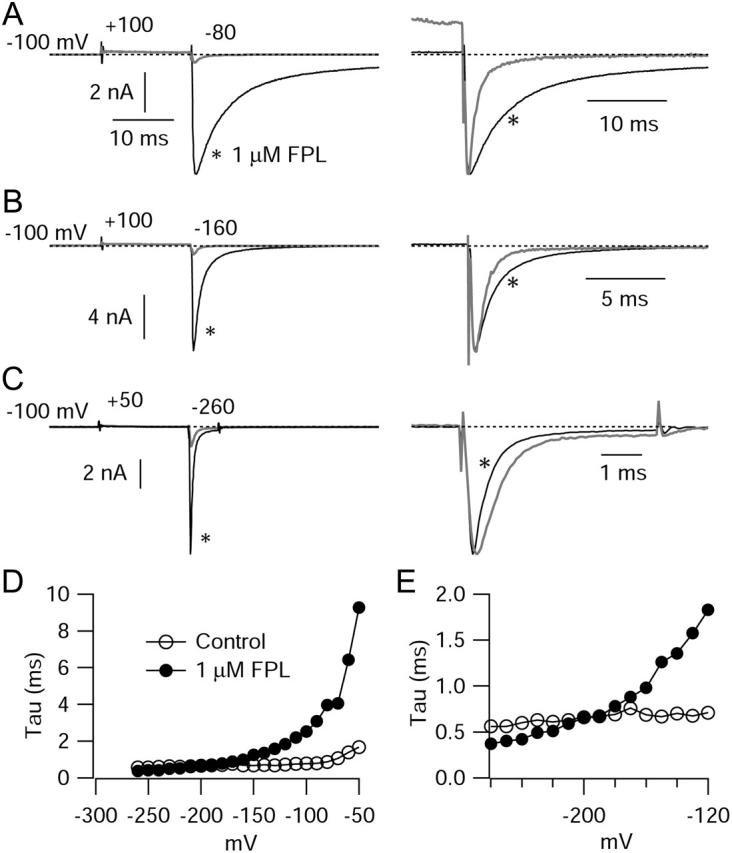
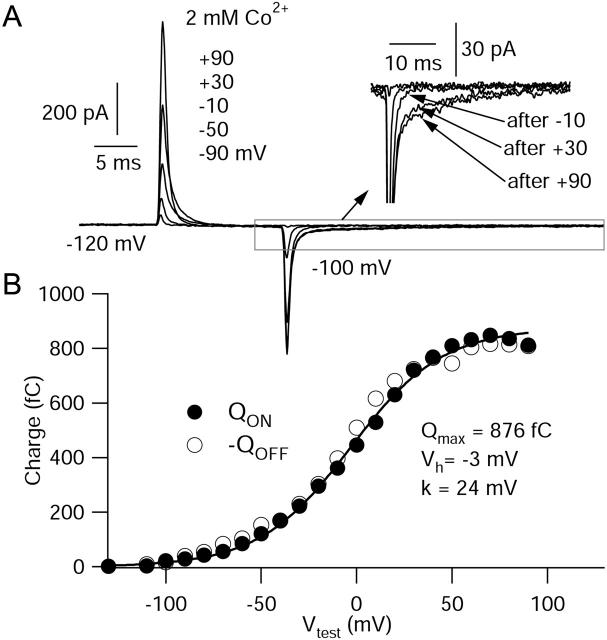
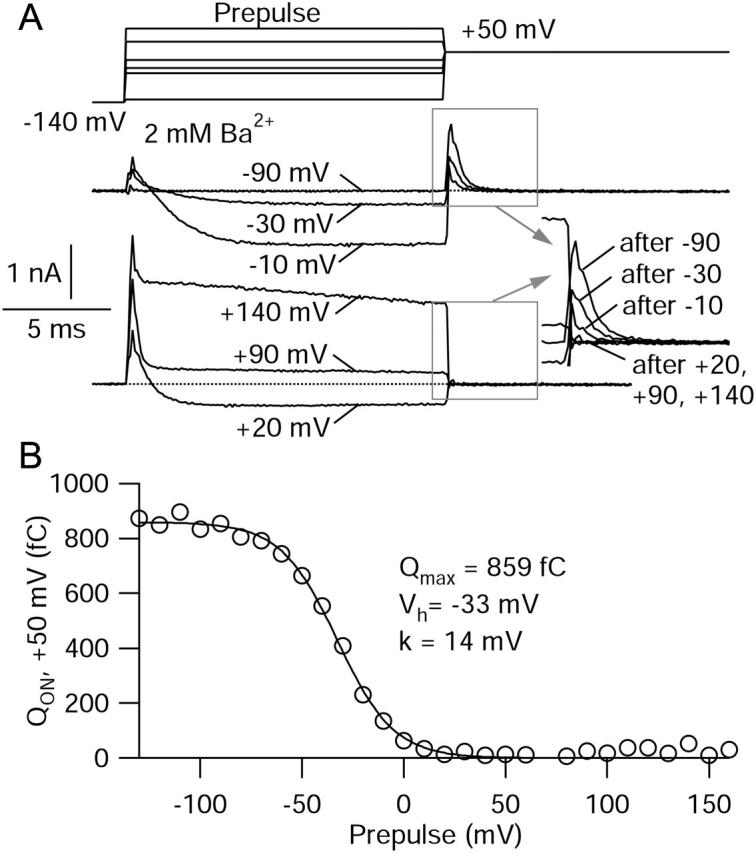
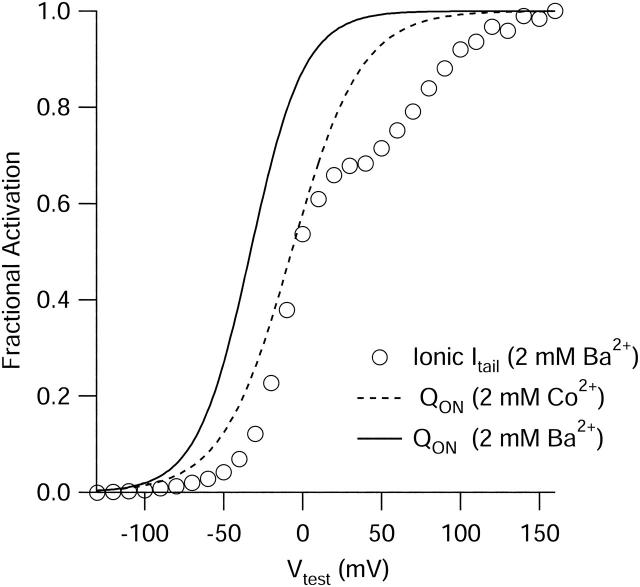
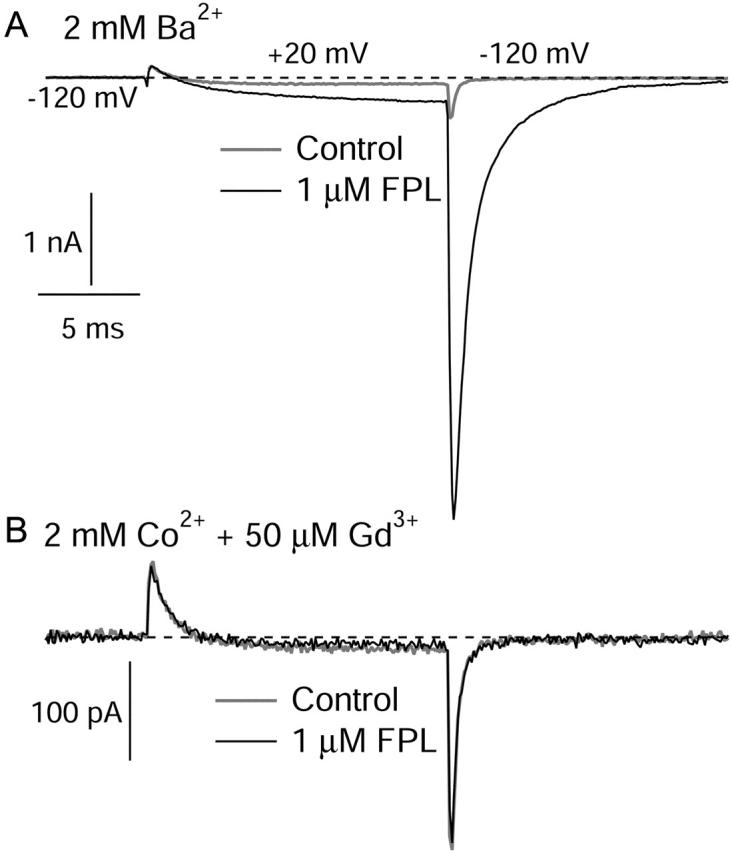
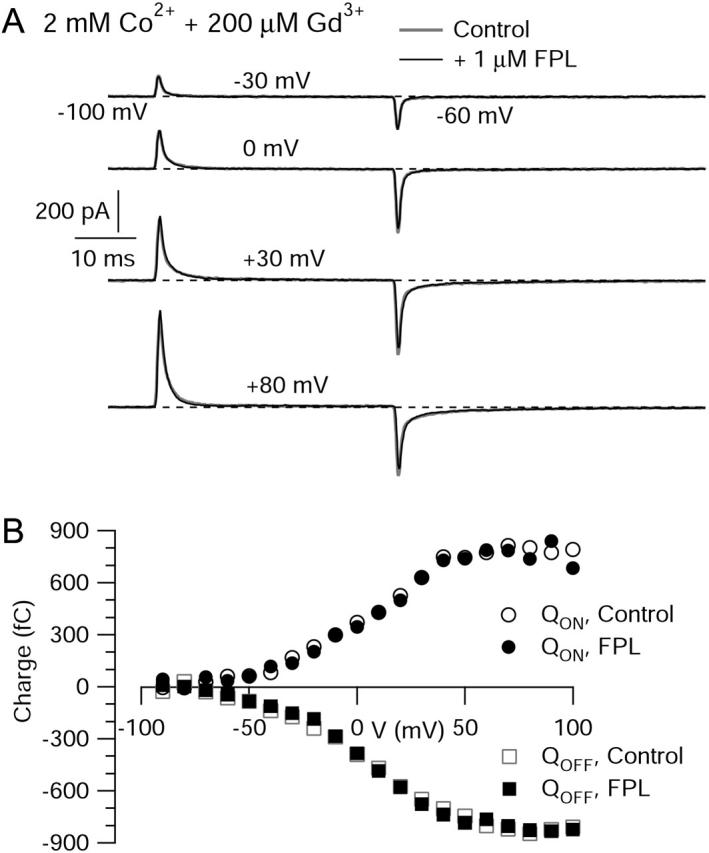
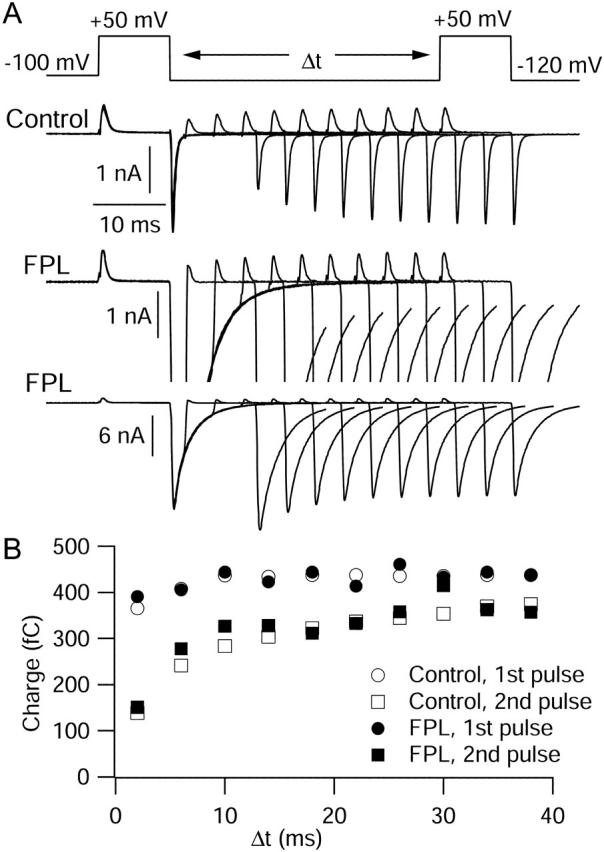
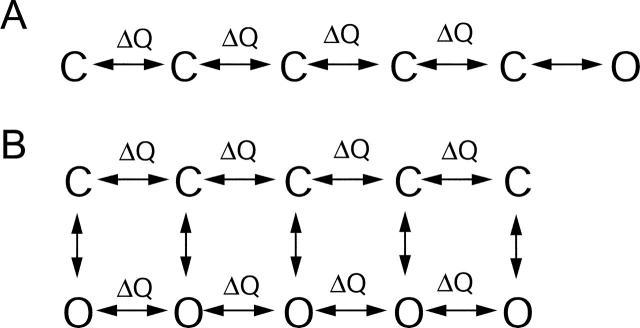
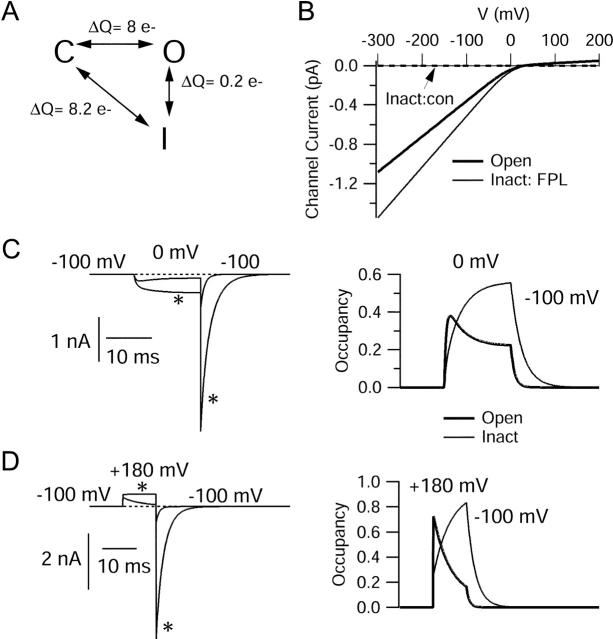
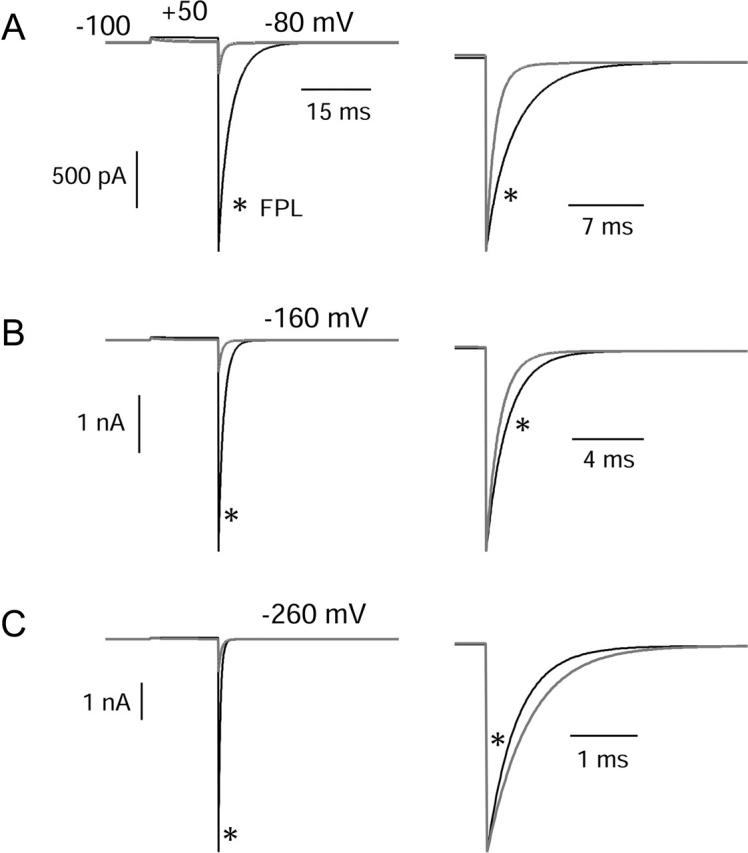
FPL 64176 (FPL) is a nondihydropyridine compound that dramatically increases macroscopic inward current through L-type calcium channels and slows activation and deactivation. To understand the mechanism by which channel behavior is altered, we compared the effects of the drug on the kinetics and voltage dependence of ionic currents and gating currents. Currents from a homogeneous population of channels were obtained using cloned rabbit Ca(V)1.2 (alpha1C, cardiac L-type) channels stably expressed in baby hamster kidney cells together with beta1a and alpha2delta1 subunits. We found a striking dissociation between effects of FPL on ionic currents, which were modified strongly, and on gating currents, which were not detectably altered. Inward ionic currents were enhanced approximately 5-fold for a voltage step from -90 mV to +10 mV. Kinetics of activation and deactivation were slowed dramatically at most voltages. Curiously, however, at very hyperpolarized voltages (< -250 mV), deactivation was actually faster in FPL than in control. Gating currents were measured using a variety of inorganic ions to block ionic current and also without blockers, by recording gating current at the reversal potential for ionic current (+50 mV). Despite the slowed kinetics of ionic currents, FPL had no discernible effect on the fundamental movements of gating charge that drive channel gating. Instead, FPL somehow affects the coupling of charge movement to opening and closing of the pore. An intriguing possibility is that the drug causes an inactivated state to become conducting without otherwise affecting gating transitions.


Figures

FIGURE 1
FIGURE 1
Enhancement of Cav1.2 currents and slowing of deactivation by FPL. (A) Currents evoked by a 15-ms depolarization to 0 mV before and 2 s after moving the cell to an external solution containing 1 μM FPL. Right panel shows test pulse current at higher gain. Linear leak and capacitative currents have been subtracted; note lack of effect of FPL on initial outward transient due to gating current. (B) Currents from a different cell evoked by a 100-ms depolarization to +10 mV, in control and with 1 μM FPL, showing slowing of activation and inactivation. Traces in FPL are marked with an asterisk.
FIGURE 2
FIGURE 2
Effects on outward currents carried by internal Cs+ and on tail currents that follow large depolarizations. Currents evoked by a 10-ms pulse to +180 mV followed by repolarization to −100 mV before and after application of 1 μM FPL. (Right) Tail currents at −100 mV on faster time base.
FIGURE 3
FIGURE 3
Effects of FPL on tail current deactivation kinetics as a function of voltage. Channels were activated by a 15 ms pulse to +100 or +50 mV, and deactivation was measured with a repolarization to voltages from −40 mV to −260 mV. (A–C) Repolarization to −80 mV, −160 mV, and −260 mV, respectively, in the same cell. In AC, at right, the control tail current (shaded) is scaled to the same amplitude as the tail in FPL (black). In C, the activating pulse was decreased to +50 mV reduce amplitude of tails. (D) Predominant tail current time constant versus voltage. In control, decay was well-fit by a single exponential from −260 to −150 mV; positive to −150 mV, a double exponential function was required; the faster time constant, accounting for 80–95% of the total, is plotted. In FPL, fits required two exponentials at all voltages; the faster time constant, accounting for 75–90% of the total amplitude, is plotted. (E) Expanded scale for time constants at hyperpolarized voltages. All measurements made at 12°C.
FIGURE 4
FIGURE 4
Voltage dependence of nonlinear charge movement using Co2+ to block ionic current. (A) Nonlinear charge movements recorded in external solution in which 2 mM Co2+ replaced Ba2+. Overlaid currents are in response to 15-ms voltage pulses to −90, −50, −10, +30, and +90 mV, followed by repolarization to −100 mV, from a steady holding voltage of −120 mV. (Inset) OFF charge movement shown at higher resolution to illustrate slow component of charge movement that follows steps to+30 mV and +90 mV. (B) Integrated charge movement evoked by the entire family of voltage pulses from −130 mV to +90 mV. (•) ON charge movement. (○) OFF charge movement. Fit is a single Boltzmann function fit to the ON charge movement, Qmax/[1 + exp(−(VVh)/k)], where Qmax is the maximal charge movement, V is the test potential, Vh is the midpoint, and k is the slope factor, with the indicated values.
FIGURE 5
FIGURE 5
Measurement of charge movement in the absence of blockers at the reversal potential for ionic current. (A) ON charge movements were recorded in 2 mM Ba2+ with steps to the reversal potential of +50 mV. The step to +50 mV was preceded by 15-ms voltage steps to voltages ranging from −130 mV to +160 mV (delivered from −140 mV). The top panel shows conditioning steps to −90 mV, −30 mV, and −10 mV. As the test voltage increases, less current is available to move during the pulse to +50 mV. ON charge movement can be seen at the beginning of the steps to −30 mV and −10 mV. The bottom panel shows conditioning steps to +20 mV, +90 mV, and +140 mV. Note the lack of further charge movement at +50 mV after these steps. The inset shows the magnification of gating current elicited by the step to +50 mV after the different conditioning voltages. (B) ON charge at +50 mV versus conditioning voltage. Fitted curve is a single Boltzmann function, Qmax/[1 + exp((VVh)/k)], where Qmax is maximal charge movement, V is the test potential, Vh is the midpoint, and k is the slope factor, with the indicated values.
FIGURE 6
FIGURE 6
Comparison of the voltage dependence of activation of ionic current with charge movement measured in Ba2+ and charge movement measured in Co2+. Fits from Fig. 4 (dashed line) and Fig. 5 (solid line), and the peak ionic tail current (open circles), are normalized to maximum and plotted as a function of voltage (all measurements from the same cell). Peak tail current in 2 mM Ba2+ was measured at −60 mV after a 15-ms pulse to the indicated test voltage (holding potential −120 mV).
FIGURE 7
FIGURE 7
Effects of FPL on ionic and gating currents. All currents shown are from the same cell. Currents were evoked by a 15-ms pulse from −120 mV to +20 mV, followed by repolarization to −120 mV. (A) Currents were measured in 2 mM Ba2+ (shaded) and in Ba2+ + 1 μM FPL (black), after which FPL was washed off in Ba2+-based solution. (B) Gating currents in response to the same protocol were then measured in 2 mM Co2+ + 50 μM Gd3+ (shaded) and this solution with 1 μM FPL (black). Upon subsequent return to FPL-free Ba2+ solution, inward ionic currents with prolonged tail currents were present (not shown). The tail currents quickened as FPL was washed out, confirming that FPL did bind in the Co2+ + Gd3+ solution.
FIGURE 8
FIGURE 8
Effects of FPL on gating currents at many voltages. (A) Currents from a single cell in response to a family of test depolarizations from a holding voltage of −100 mV. Currents shown were evoked by pulses to −30 mV, 0 mV, +30 mV, and +80 mV, followed by repolarization to −60 mV, in 2 mM Co2+ + 200 mM Gd3+ without (shaded) and with (black) 1 μM FPL. Traces shown are single sweeps, leak-subtracted with appropriately scaled currents evoked by an average of 10 or 20 steps from −100 mV to −120 mV. (B) ON (circles) and OFF (squares) charge movement integrated from the currents above, in control (open symbols) and in 1 μM FPL (solid symbols).
FIGURE 9
FIGURE 9
Simultaneous measurement of the effects of FPL on ionic and gating currents. (A) Currents elicited by a family of 10 voltage jump protocols. Each protocol (top) consisted of two 10-ms steps to the reversal potential of +50 mV, separated by a step to −120 mV of variable duration. The initial step to −120 mV lasted 2 ms, and each subsequent step was incremented by 4 ms. All measurements were taken in 2 mM Ba2+ with no ionic blockers. Control currents (top row of currents) showed progressive growth (as the step to −120 mV was lengthened) of both gating current at the start of the second step to +50 mV and tail current after this step. The currents in FPL are shown at two different scales: at the same scale as control (middle row of currents) to allow comparison of gating currents, and at a compressed scale to show the enhancement of tail currents (bottom row). (B) Total charge movement during the first (circles) and second (squares) steps to +50 mV, in control (open symbols) and in FPL (solid symbols), as a function of the interpulse time at −120 mV. ON currents at +50 mV were integrated for 6 ms, starting 0.8 ms after the onset of the voltage step.
FIGURE 10
FIGURE 10
Kinetic models for calcium channel gating in which FPL affects only nonvoltage-dependent gating steps. (A) Model based on Zagotta and Aldrich (1990) in which four sequential activation steps involving charge movement are followed by a nonvoltage-dependent pore-opening step. (B) Allosteric model based on Marks and Jones (1992) in which movement of gating charge can occur between both closed (upper row) and open (bottom row) states and in which pore opening does not involve charge movement but is favored by progressive movement of charge.
FIGURE 11
FIGURE 11
Model for action of FPL based on modification of permeability of a normally nonconducting (inactivated) state. (A) Gating scheme. In the absence of drug, channels interconvert between three states, a closed state (C), occupied at rest, and two states occupied during depolarizations, a conducting open state (O), and a nonconducting inactivated state (I). During step depolarizations, entry into the open state is faster than into the inactivated state but at equilibrium more channels are in the inactivated state. In the presence of drug, gating transitions are hypothesized to be exactly the same as in the absence of drug; the only difference is that the inactivated state is conducting. (B) Current-voltage relationships hypothesized for the open state (thick solid line) and the “inactivated” state with FPL present (thin solid line) and without FPL (nonconducting, dashed line). (C) Predicted currents for step to 0 mV followed by repolarization to −100 mV (left) and (right) time course of relative occupancy of open (thick lines) and inactivated states (thin lines). (D) Predicted currents for step to +180 mV followed by repolarization to −100 mV (left) and time course of relative occupancy of open and inactivated states (right). Rate constants (ms-1): kCO = 1 × exp(V/3.2), kOC = 1 × exp(−V/500), kOI = 0.01, kIO = 0.0039 × exp(−V/110), kCI = 0.33 × exp(V/3.2), kIC = 0.13 × exp(−V/90).
FIGURE 12
FIGURE 12
Predicted tail currents with and without FPL. Same model and parameters as in Fig. 11. Control currents are shaded traces and currents in FPL are black. Channels were activated by a 15-ms step from −100 mV to +50 mV, and tail currents were then elicited by repolarization to voltages of −80 mV (A), −160 mV (B), or −260 mV (C). Right panels show predicted control and FPL-modified currents scaled to match peak tail currents, as in Fig. 3.

Similar articles

Cited by

References

    1. Altier, C., R. L. Spaetgens, J. Nargeot, E. Bourinet, and G. W. Zamponi. 2001. Multiple structural elements contribute to voltage-dependent facilitation of neuronal α1C (CaV1.2) L-type calcium channels. Neuropharmacology. 40:1050–1057. - PubMed
    1. Artigas, P., G. Ferreira, N. Reyes, G. Brum, and G. Pizarro. 2003. Effects of the enantiomers of BayK 8644 on the charge movement of L-type Ca channels in guinea-pig ventricular myocytes. J. Membr. Biol. 193:215–227. - PubMed
    1. Baxter, A. J. G., J. Dixon, F. Ince, C. N. Manners, and S. J. Teague. 1993. Discovery and synthesis of methyl 2,5-dimethyl-4-[2-(phenylmethyl)benzoyl]-1H-pyrrole-3-carboxylate (FPL 64176) and analogues: the first examples of a new class of calcium channel activator. J. Med. Chem. 36:2739–2744. - PubMed
    1. Bean, B. P. 1993. Beta-adrenergic modulation of cardiac Ca channel gating. In Ion Channels in the Cardiovascular System: Function and Dysfunction. A. M. Brown, W. A. Catterall, P. M. Spooner, and H. C. Strauss, editors. Futura Press, Armonk, NY. 237–252.
    1. Bean, B. P., M. C. Nowycky, and R. W. Tsien. 1984. Beta-adrenergic modulation of calcium channels in frog ventricular heart cells. Nature. 307:371–375. - PubMed

Publication types

MeSH terms

LinkOut - more resources