

Comparing folding codes in simple heteropolymer models of protein evolutionary landscape: robustness of the superfunnel paradigm
- PMID: 15501948
- PMCID: PMC1304991
- DOI: 10.1529/biophysj.104.050369
Comparing folding codes in simple heteropolymer models of protein evolutionary landscape: robustness of the superfunnel paradigm
Abstract
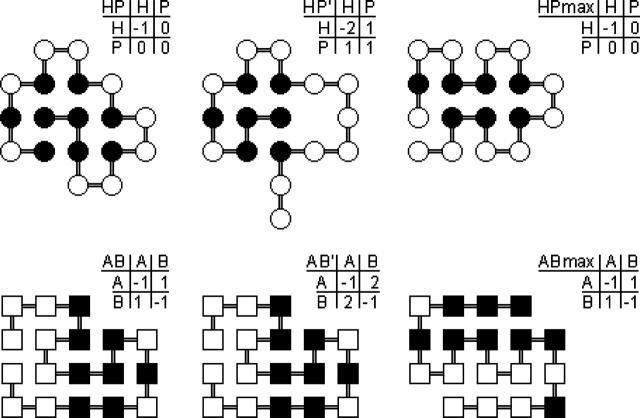
Understanding the evolution of biopolymers is a key element in rationalizing their structures and functions. Simple exact models (SEMs) are well-positioned to address general principles of evolution as they permit the exhaustive enumeration of both sequence and structure (conformational) spaces. The physics-based models of the complete mapping between genotypes and phenotypes afforded by SEMs have proven valuable for gaining insight into how adaptation and selection operate among large collections of sequences and structures. This study compares the properties of evolutionary landscapes of a variety of SEMs to delineate robust predictions and possible model-specific artifacts. Among the models studied, the ruggedness of evolutionary landscape is significantly model-dependent; those derived from more protein-like models appear to be smoother. We found that a common practice of restricting protein structure space to maximally compact lattice conformations results in (i.e., "designs in") many encodable (designable) structures that are not otherwise encodable in the corresponding unrestrained structure space. This discrepancy is especially severe for model potentials that seek to mimic the major role of hydrophobic interactions in protein folding. In general, restricting conformations to be maximally compact leads to larger changes in the model genotype-phenotype mapping than a moderate shifting of reference state energy of the model potential function to allow for more specific encoding via the "designing out" effects of repulsive interactions. Despite these variations, the superfunnel paradigm applies to all SEMs we have tested: For a majority of neutral nets across different models, there exists a funnel-like organization of native stabilities for the sequences in a neutral net encoding for the same structure, and the thermodynamically most stable sequence is also the most robust against mutation.
Figures
Similar articles
-
Modeling evolutionary landscapes: mutational stability, topology, and superfunnels in sequence space.Proc Natl Acad Sci U S A. 1999 Sep 14;96(19):10689-94. doi: 10.1073/pnas.96.19.10689. Proc Natl Acad Sci U S A. 1999. PMID: 10485887 Free PMC article.
-
Recombinatoric exploration of novel folded structures: a heteropolymer-based model of protein evolutionary landscapes.Proc Natl Acad Sci U S A. 2002 Jan 22;99(2):809-14. doi: 10.1073/pnas.022240299. Proc Natl Acad Sci U S A. 2002. PMID: 11805332 Free PMC article.
-
A correlation-based method for the enhancement of scoring functions on funnel-shaped energy landscapes.Proteins. 2006 Apr 1;63(1):155-64. doi: 10.1002/prot.20853. Proteins. 2006. PMID: 16397892
-
Principles of protein folding--a perspective from simple exact models.Protein Sci. 1995 Apr;4(4):561-602. doi: 10.1002/pro.5560040401. Protein Sci. 1995. PMID: 7613459 Free PMC article. Review.
-
The folding energy landscape and free energy excitations of cytochrome c.Acc Chem Res. 2010 May 18;43(5):652-60. doi: 10.1021/ar9002703. Acc Chem Res. 2010. PMID: 20143816 Free PMC article. Review.
Cited by
-
Biphasic patterns of diversification and the emergence of modules.Front Genet. 2012 Aug 7;3:147. doi: 10.3389/fgene.2012.00147. eCollection 2012. Front Genet. 2012. PMID: 22891076 Free PMC article.
-
Evolutionary dynamics on protein bi-stability landscapes can potentially resolve adaptive conflicts.PLoS Comput Biol. 2012;8(9):e1002659. doi: 10.1371/journal.pcbi.1002659. Epub 2012 Sep 13. PLoS Comput Biol. 2012. PMID: 23028272 Free PMC article.
-
Neutral evolution of protein-protein interactions: a computational study using simple models.BMC Struct Biol. 2007 Nov 19;7:79. doi: 10.1186/1472-6807-7-79. BMC Struct Biol. 2007. PMID: 18021454 Free PMC article.
-
Evolvability and single-genotype fluctuation in phenotypic properties: a simple heteropolymer model.Biophys J. 2010 Jun 2;98(11):2487-96. doi: 10.1016/j.bpj.2010.02.046. Biophys J. 2010. PMID: 20513392 Free PMC article.
-
Protein ensembles link genotype to phenotype.PLoS Comput Biol. 2019 Jun 20;15(6):e1006648. doi: 10.1371/journal.pcbi.1006648. eCollection 2019 Jun. PLoS Comput Biol. 2019. PMID: 31220071 Free PMC article. Review.
References
-
- Ancel, L. W., and W. Fontana. 2000. Plasticity, evolvability, and modularity in RNA. J. Exp. Zool. 288:242–283. - PubMed
-
- Backofen, R., S. Will, and E. Bornberg-Bauer. 1999. Application of constraint programming techniques for structure prediction of lattice proteins with extended alphabets. Bioinformatics. 15:234–242. - PubMed
-
- Bastolla, U., M. Porto, H. E. Roman, and M. Vendruscolo. 2003a. Connectivity of neutral networks, overdispersion, and structural conservation in protein evolution. J. Mol. Evol. 56:243–254. - PubMed
-
- Bastolla, U., M. Porto, H. E. Roman, and M. Vendruscolo. 2003b. Statistical properties of neutral evolution. J. Mol. Evol. 57:S103–S119. - PubMed
Publication types
MeSH terms
Substances
LinkOut - more resources
Full Text Sources
