

The effects of propofol, small-dose isoflurane, and nitrous oxide on cortical somatosensory evoked potential and bispectral index monitoring in adolescents undergoing spinal fusion
- PMID: 15502027
- PMCID: PMC2435242
- DOI: 10.1213/01.ANE.0000134807.73615.5C
The effects of propofol, small-dose isoflurane, and nitrous oxide on cortical somatosensory evoked potential and bispectral index monitoring in adolescents undergoing spinal fusion
Abstract
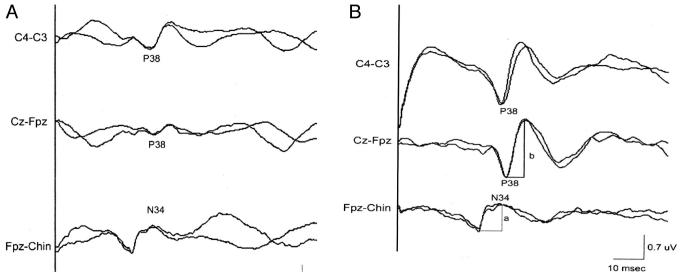
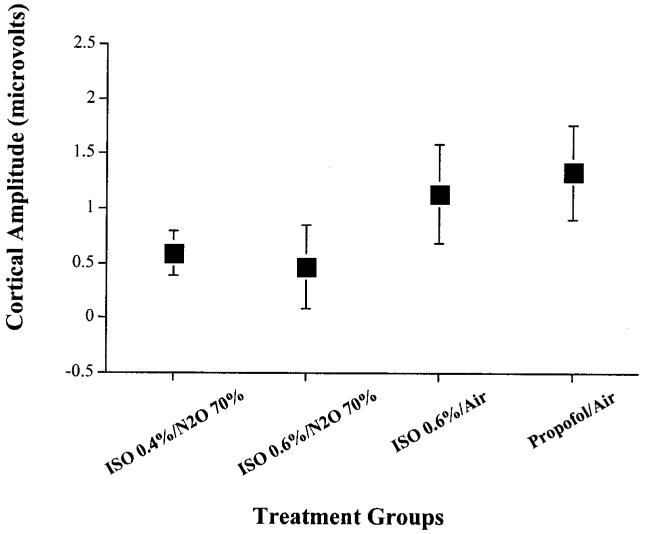
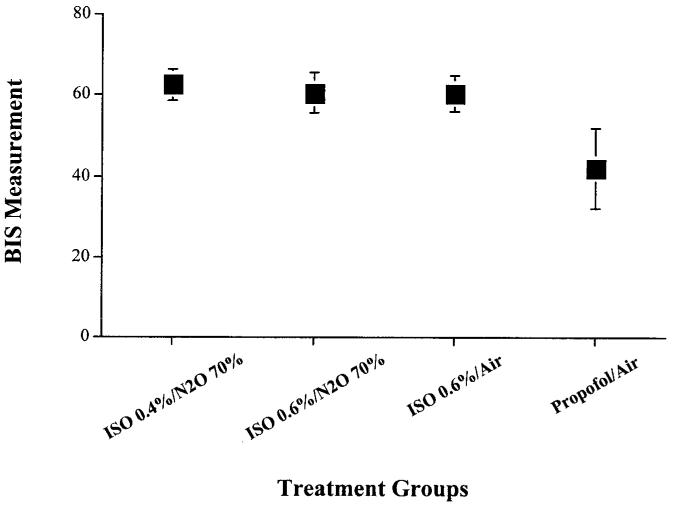
In this study we compared the effects of propofol, small-dose isoflurane, and nitrous oxide (N(2)O) on cortical somatosensory evoked potentials (SSEP) and bispectral index (BIS) monitoring in adolescents undergoing spinal fusion. Twelve patients received the following anesthetic maintenance combinations in a randomly determined order: treatment #1: isoflurane 0.4% + N(2)O 70% + O(2) 30%; treatment #2: isoflurane 0.6% + N(2)O 70% + O(2) 30%; treatment #3: isoflurane 0.6% + air + O(2) 30%; treatment #4: propofol 120 microg . kg(-1) . min(-1) + air + O(2) 30%. Cortical SSEP amplitudes measured during anesthesia maintenance with treatment #3 (isoflurane 0.6%/air) were more than those measured during maintenance with treatment #1 (isoflurane 0.4%/N(2)O 70%) (P < 0.0001) and treatment #2 (isoflurane 0.6%/N(2)O 70%) (P < 0.0052). Cortical SSEP amplitudes measured during treatment #4 (propofol 120 microg . kg(-1) . min(-1)/air) were more than treatment #1 (isoflurane 0.4%/N(2)O 70%) (P < 0.0001), treatment #2 (Iso 0.6%/N(2)O 70%) (P < 0.0007), and treatment #3 (isoflurane 0.6%/air) (P < 0.0191). In addition, average BIS values measured during treatments 1, 2, 3 and 4 were 62, 62, 61, and 44 respectively. Only treatment #4 (propofol 120 microg . kg(-1) . min(-1)/air) uniformly maintained BIS values less than 60. Our study demonstrates that propofol better preserves cortical SSEP amplitude measurement and provides a deeper level of hypnosis as measured by BIS values than combinations of small-dose isoflurane/N(2)O or small-dose isoflurane alone.
Figures
References
-
- Banoub M, Tetzlaff JE, Schubert A. Pharmacologic and physiologic influences affecting sensory evoked potentials. Anesthesiology. 2003;99:716–37. - PubMed
-
- Sebel PS, Ingram DA, Flynn PJ, et al. Evoked potentials during isoflurane anaesthesia. Br J Anaesth. 1986;58:580–5. - PubMed
-
- McPherson RW, Mahla M, Johnson R, Traystman RJ. Effects of enflurane, isoflurane, and nitrous oxide on somatosensory evoked potentials during fentanyl anesthesia. Anesthesiology. 1985;62:626–33. - PubMed
-
- Pathak KS, Ammadio M, Kalamachi A. Effects of halothane, enflurane, and isoflurane on somatosensory evoked potentials during nitrous oxide anesthesia. Anesthesiology. 1987;66:753–7. - PubMed
-
- Peterson DO, Drummond JC, Todd MM. Effects of halothane, enflurane, isoflurane, and nitrous oxide on somatosensory evoked potentials in humans. Anesthesiology. 1986;65:35–40. - PubMed
Publication types
MeSH terms
Substances
Grants and funding
LinkOut - more resources
Full Text Sources
Miscellaneous
