Comparative Study
. 2004 Oct 25;3(1):39.
doi: 10.1186/1475-925X-3-39.

Multimodal pressure-flow method to assess dynamics of cerebral autoregulation in stroke and hypertension

Affiliations
Comparative Study

Multimodal pressure-flow method to assess dynamics of cerebral autoregulation in stroke and hypertension

Vera Novak et al. Biomed Eng Online. .

Abstract

Background: This study evaluated the effects of stroke on regulation of cerebral blood flow in response to fluctuations in systemic blood pressure (BP). The autoregulatory dynamics are difficult to assess because of the nonstationarity and nonlinearity of the component signals.

Methods: We studied 15 normotensive, 20 hypertensive and 15 minor stroke subjects (48.0 +/- 1.3 years). BP and blood flow velocities (BFV) from middle cerebral arteries (MCA) were measured during the Valsalva maneuver (VM) using transcranial Doppler ultrasound.

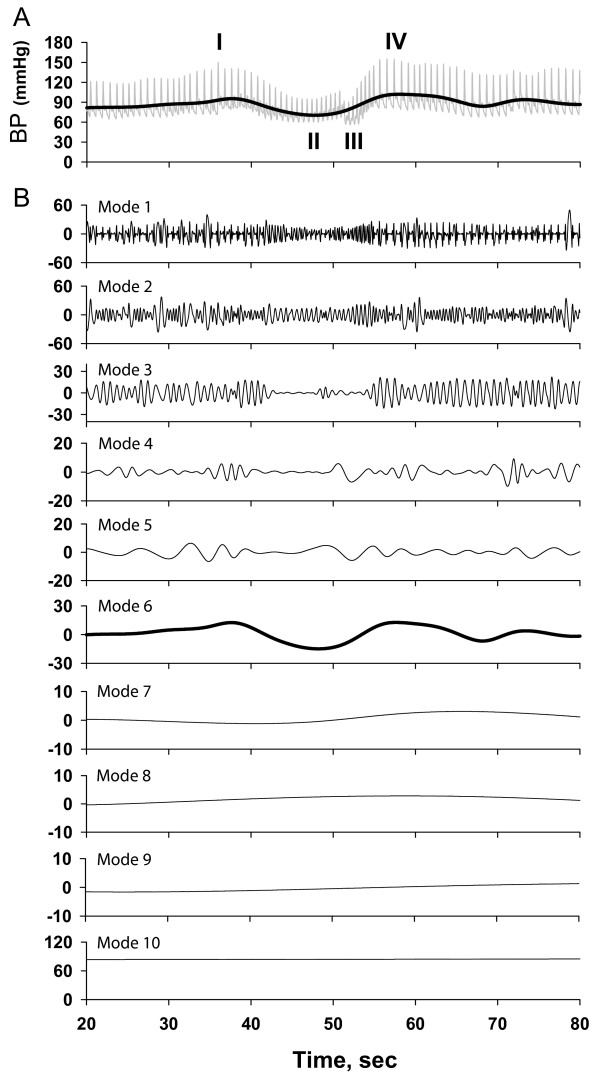
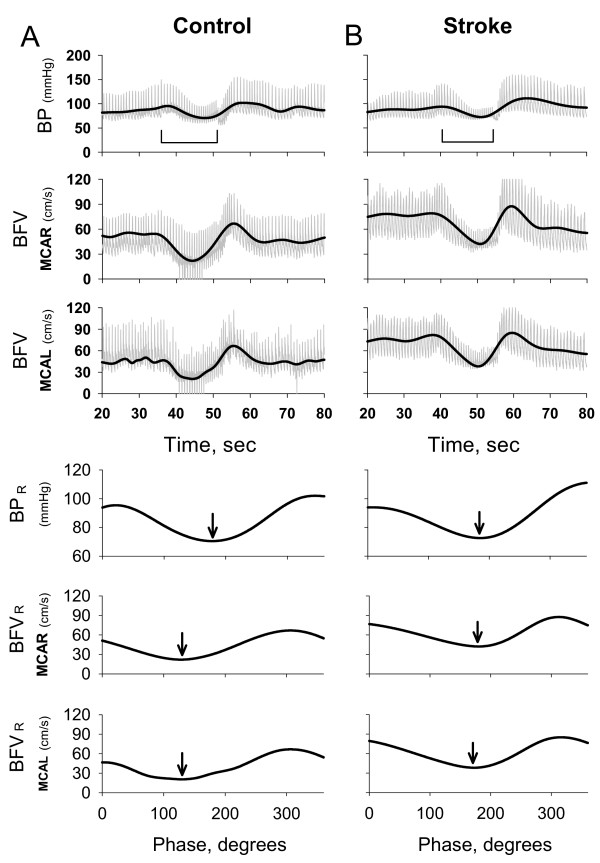
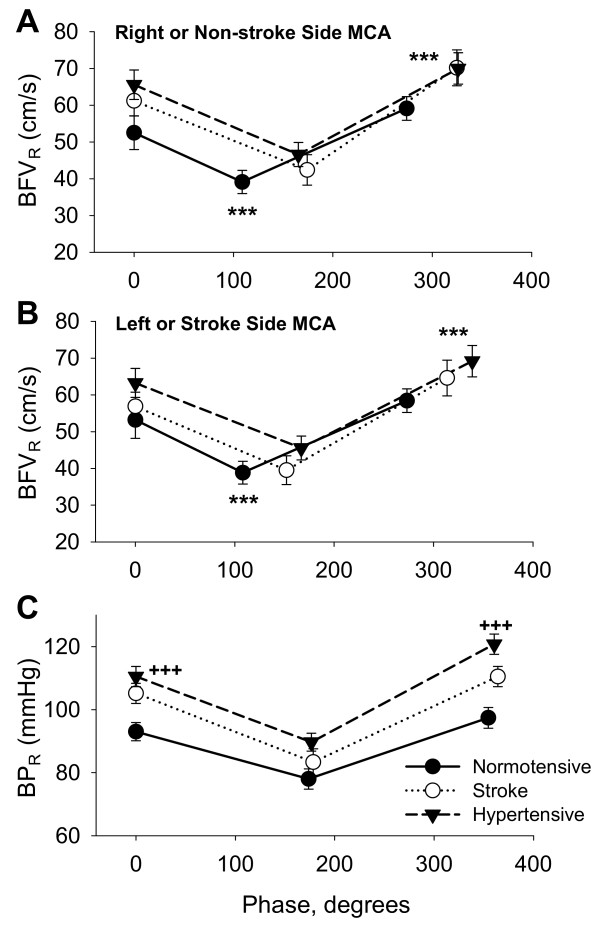
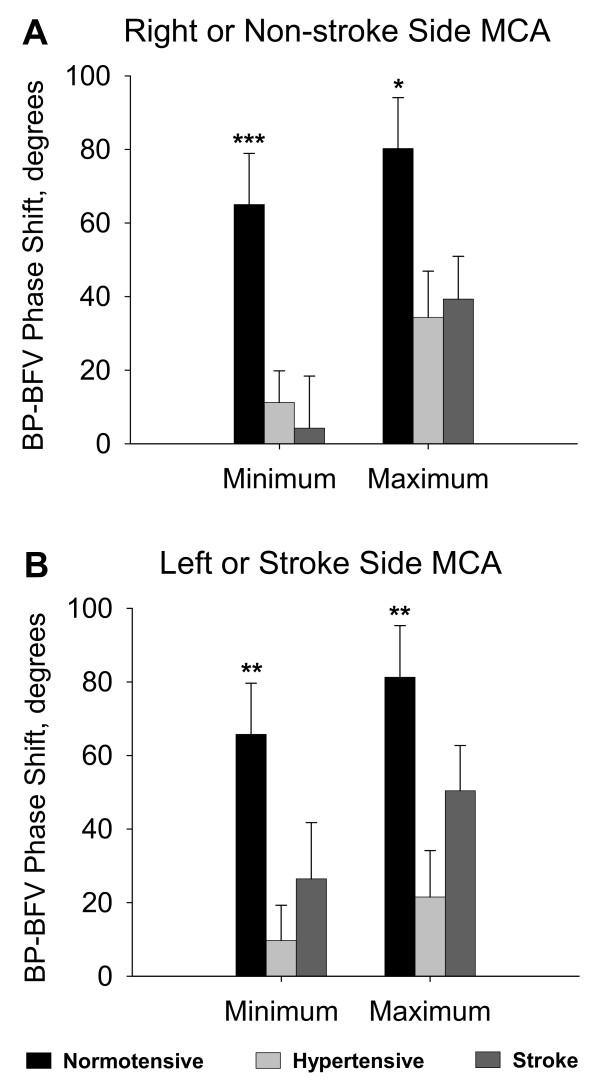
Results: A new technique, multimodal pressure-flow analysis (MMPF), was implemented to analyze these short, nonstationary signals. MMPF analysis decomposes complex BP and BFV signals into multiple empirical modes, representing their instantaneous frequency-amplitude modulation. The empirical mode corresponding to the VM BP profile was used to construct the continuous phase diagram and to identify the minimum and maximum values from the residual BP (BPR) and BFV (BFVR) signals. The BP-BFV phase shift was calculated as the difference between the phase corresponding to the BPR and BFVR minimum (maximum) values. BP-BFV phase shifts were significantly different between groups. In the normotensive group, the BFVR minimum and maximum preceded the BPR minimum and maximum, respectively, leading to large positive values of BP-BFV shifts.

Conclusion: In the stroke and hypertensive groups, the resulting BP-BFV phase shift was significantly smaller compared to the normotensive group. A standard autoregulation index did not differentiate the groups. The MMPF method enables evaluation of autoregulatory dynamics based on instantaneous BP-BFV phase analysis. Regulation of BP-BFV dynamics is altered with hypertension and after stroke, rendering blood flow dependent on blood pressure.


Figures

Figure 1
Figure 1
Schematic diagram showing Hilbert-Huang decomposition of the original blood pressure (BP) signal into the empirical modes corresponding to amplitude-frequency modulation for different time scales. Panel A shows the profile of the BP waveform over the course of the VM: I- indicates the beginning of the maneuver, II- the duration of straining, III-the end of straining and IV- the BP overshoot above baseline. (Note that the transient BP decrease in phase III is due to inspiration.) Panel B shows the empirical modes for each component frequencies and their corresponding amplitudes were detected from the signal (mode 1–10). Empirical modes corresponding to the faster frequencies (modes 1–5) were removed from the original BP and BFV signals. The empirical mode corresponding to the characteristic BP profile induced by the VM (BPVM – mode 6 in this example) was used to obtain phase information. Modes 7–10 reflect BP modulations at slow frequencies. Similarly, the empirical mode corresponding to the characteristic BFV profile was extracted from the raw BFV waveform (not shown).
Figure 2
Figure 2
Panel A shows blood pressure (BP) and blood flow velocity (BFV) waveforms from the right and left MCAs (MCAR and MCAL respectively) during the VM for a normotensive subject (top 3 panels). The duration of the VM straining is indicated by a horizontal line. The thick black line indicates the BPR and BFVR that reflect the characteristic VM oscillation. Bottom 3 panels show BPR and BFVR in the MCAR and MCAL. Arrows indicate phases at the BPR and BFVR minima. With normal autoregulation, BFVR minimum preceded BPR minimum. Panel B shows BP and BFV waveforms for a subject with a left temporal infarct (MCAR = non stroke-side MCA, MCAL = stroke side MCA) (top 3 panels). Horizontal line indicates duration of the VM. Black thick line indicates the BPR and BFVR obtained from the BP and BFV raw waveforms. Bottom 3 panels show BPR and BFVR in the non-stroke side MCA and in the stroke-side MCA expressed as a function of BPVM phase. Arrows indicate that the phase at BFV minimum was similar to the phase at BP minimum.
Figure 3
Figure 3
Panel A shows the phase and corresponding residual blood flow velocity (BFVR) values at baseline, BFVR minimum and BFVR maximum for the right MCA for the normotensive -●- and - -▼- hypertensive groups and for - O- the non-stroke side MCA in the stroke group. Panel B shows the phase and corresponding BFVR values for the left MCA in the normotensive and hypertensive groups and for the stroke side MCA in the stroke group. BFVR phase was significantly greater in the stroke and hypertensive groups compared to the normotensive group for BFVR minimum and maximum in both MCAs (between groups phase comparisons *** p < 0.005, ** p < 0.01). Panel C shows the phase and corresponding residual blood pressure (BPR) values for the BPR minimum and maximum (between groups BPR values comparisons +++ p < 0.001, mean ± SE).
Figure 4
Figure 4
Panel A shows the phase shift between BPR minimum and BFVR minimum and the phase shift between BPR maximum and BFVR maximum for the right MCA for the □ normotensive and hypertensive groups and ■ for the non-stroke side MCA in the stroke group. Figure 4B shows the phase shift between BPR minimum and BFVR minimum and the phase shift between BPR maximum and BFVR maximum for the left MCA for the normotensive, and hypertensive groups and for the stroke side MCA in the stroke group. Phase shift was greater in the normotensive compared to other groups (between group comparisons *** p < 0.005, ** p < 0.01 *p < 0.05, mean ± SE).

References

    1. Schwarz S, Georgiadis D, Aschoff A, Schwab S. Effects of body position on intracranial pressure and cerebral perfusion in patients with large hemispheric stroke. Stroke. 2002;33:497–501. doi: 10.1161/hs0202.102376. - DOI - PubMed
    1. Eames PJ, Blake MJ, Dawson SL, Panerai RB, Potter J. Dynamic cerebral autoregulation and beat-to-beat blood pressure control are impaired in acute ischaemic stroke. J Neurol Neurosurg Psychiatry. 2002;72:467–473. - PMC - PubMed
    1. Dawson SL, Panerai RB, Potter JF. Serial changes in static and dynamic cerebral autoregulation after acute ischaemic stroke. Cerebrovasc Dis. 2003;16:69–75. doi: 10.1159/000070118. - DOI - PubMed
    1. Zhang R, Zuckerman JH, Giller CA, Levine BD. Transfer function analysis of dynamic cerebral autoregulation in humans. Am J Physiol. 1998;274:H233–41. - PubMed
    1. Tiecks FP, Lam AM, Matta BF, Strebel S, Douville C, Newell DW. Effects of the Valsalva maneuver on cerebral circulation in healthy adults. A transcranial Doppler Study. Stroke. 1995;26:1386–1392. - PubMed

Publication types