

Microarray and comparative genomics-based identification of genes and gene regulatory regions of the mouse immune system
- PMID: 15504237
- PMCID: PMC534115
- DOI: 10.1186/1471-2164-5-82
Microarray and comparative genomics-based identification of genes and gene regulatory regions of the mouse immune system
Abstract
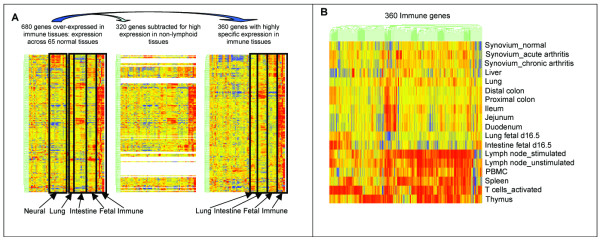
Background: In this study we have built and mined a gene expression database composed of 65 diverse mouse tissues for genes preferentially expressed in immune tissues and cell types. Using expression pattern criteria, we identified 360 genes with preferential expression in thymus, spleen, peripheral blood mononuclear cells, lymph nodes (unstimulated or stimulated), or in vitro activated T-cells.
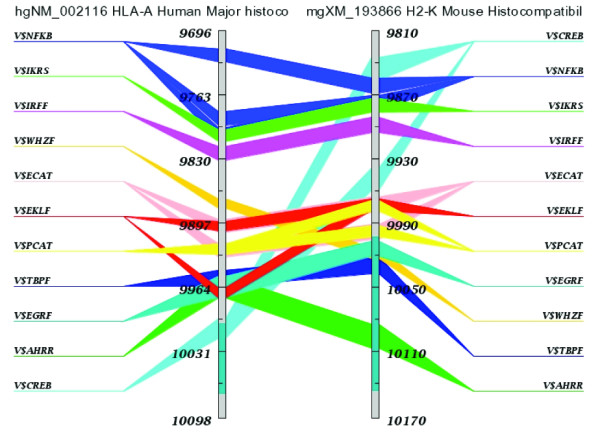
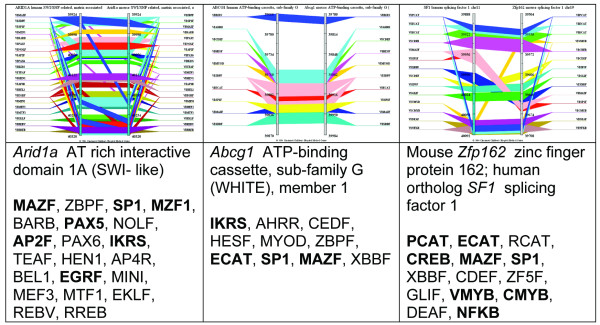
Results: Gene clusters, formed based on similarity of expression-pattern across either all tissues or the immune tissues only, had highly significant associations both with immunological processes such as chemokine-mediated response, antigen processing, receptor-related signal transduction, and transcriptional regulation, and also with more general processes such as replication and cell cycle control. Within-cluster gene correlations implicated known associations of known genes, as well as immune process-related roles for poorly described genes. To characterize regulatory mechanisms and cis-elements of genes with similar patterns of expression, we used a new version of a comparative genomics-based cis-element analysis tool to identify clusters of cis-elements with compositional similarity among multiple genes. Several clusters contained genes that shared 5-6 cis-elements that included ETS and zinc-finger binding sites. cis-Elements AP2 EGRF ETSF MAZF SP1F ZF5F and AREB ETSF MZF1 PAX5 STAT were shared in a thymus-expressed set; AP4R E2FF EBOX ETSF MAZF SP1F ZF5F and CREB E2FF MAZF PCAT SP1F STAT cis-clusters occurred in activated T-cells; CEBP CREB NFKB SORY and GATA NKXH OCT1 RBIT occurred in stimulated lymph nodes.
Conclusion: This study demonstrates a series of analytic approaches that have allowed the implication of genes and regulatory elements that participate in the differentiation, maintenance, and function of the immune system. Polymorphism or mutation of these could adversely impact immune system functions.
Figures

Similar articles
-
CisMols Analyzer: identification of compositionally similar cis-element clusters in ortholog conserved regions of coordinately expressed genes.Nucleic Acids Res. 2005 Jul 1;33(Web Server issue):W408-11. doi: 10.1093/nar/gki486. Nucleic Acids Res. 2005. PMID: 15980500 Free PMC article.
-
Microarray-based discovery of highly expressed olfactory mucosal genes: potential roles in the various functions of the olfactory system.Physiol Genomics. 2003 Dec 16;16(1):67-81. doi: 10.1152/physiolgenomics.00117.2003. Physiol Genomics. 2003. PMID: 14570983
-
Identification of putative cis-regulatory elements in Cryptosporidium parvum by de novo pattern finding.BMC Genomics. 2007 Jan 9;8:13. doi: 10.1186/1471-2164-8-13. BMC Genomics. 2007. PMID: 17212834 Free PMC article.
-
Genomics in the immune system.Clin Immunol. 2004 May;111(2):175-85. doi: 10.1016/j.clim.2004.01.001. Clin Immunol. 2004. PMID: 15137950 Review.
-
Decoding cis-regulatory systems in ascidians.Zoolog Sci. 2005 Feb;22(2):129-46. doi: 10.2108/zsj.22.129. Zoolog Sci. 2005. PMID: 15738634 Review.
Cited by
-
Sphingosine 1-phosphate lyase, a key regulator of sphingosine 1-phosphate signaling and function.Adv Enzyme Regul. 2010;50(1):349-62. doi: 10.1016/j.advenzreg.2009.10.024. Epub 2009 Nov 13. Adv Enzyme Regul. 2010. PMID: 19914275 Free PMC article. Review. No abstract available.
-
Reorganization of the host epigenome by a viral oncogene.Genome Res. 2012 Jul;22(7):1212-21. doi: 10.1101/gr.132308.111. Epub 2012 Apr 12. Genome Res. 2012. PMID: 22499665 Free PMC article.
-
Novel insights into the relationships between dendritic cell subsets in human and mouse revealed by genome-wide expression profiling.Genome Biol. 2008 Jan 24;9(1):R17. doi: 10.1186/gb-2008-9-1-r17. Genome Biol. 2008. PMID: 18218067 Free PMC article.
-
Dynamic SPR monitoring of yeast nuclear protein binding to a cis-regulatory element.Biochem Biophys Res Commun. 2007 Nov 9;363(1):153-8. doi: 10.1016/j.bbrc.2007.08.130. Epub 2007 Aug 30. Biochem Biophys Res Commun. 2007. PMID: 17850763 Free PMC article.
-
Characterization of bovine FUT7 furthers understanding of FUT7 evolution in mammals.BMC Genet. 2012 Aug 21;13:74. doi: 10.1186/1471-2156-13-74. BMC Genet. 2012. PMID: 22909383 Free PMC article.
References
-
- O'Riordan M, Grosschedl R. Transcriptional regulation of early B-lymphocyte differentiation. Immunol Rev. 2000;175:94–103. - PubMed
Publication types
MeSH terms
Grants and funding
LinkOut - more resources
Full Text Sources
Medical
Molecular Biology Databases
Research Materials
