

In vivo assessment of drug efficacy against Plasmodium falciparum malaria: duration of follow-up
- PMID: 15504852
- PMCID: PMC525402
- DOI: 10.1128/AAC.48.11.4271-4280.2004
In vivo assessment of drug efficacy against Plasmodium falciparum malaria: duration of follow-up
Abstract
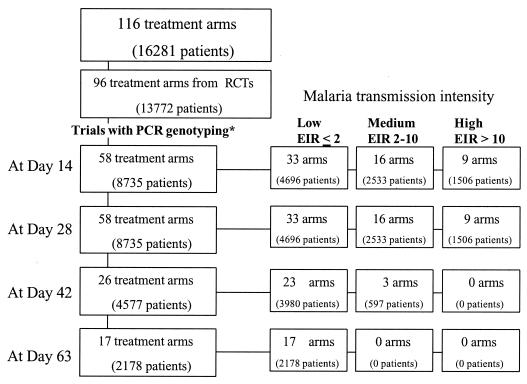
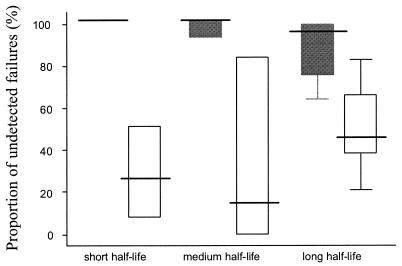
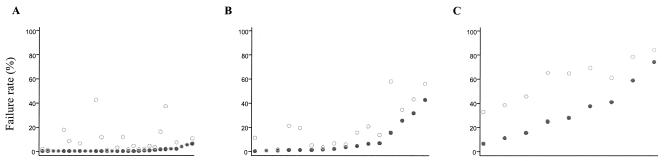
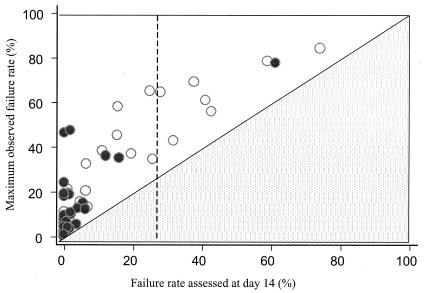
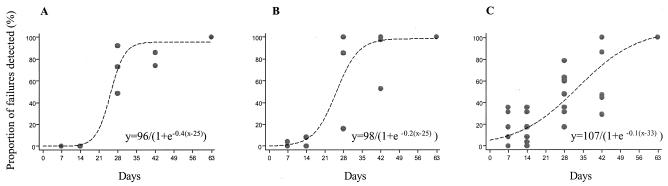
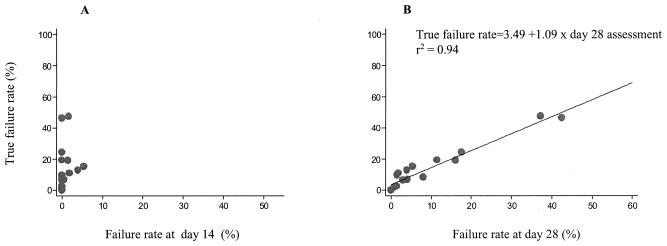
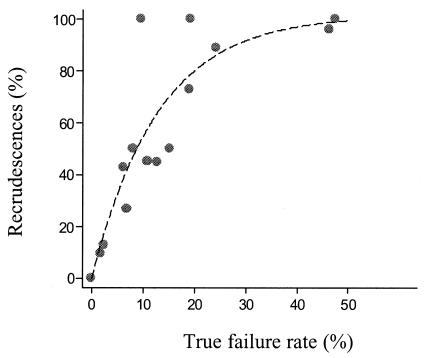
To determine the optimum duration of follow-up for the assessment of drug efficacy against Plasmodium falciparum malaria, 96 trial arms from randomized controlled trials (RCTs) with follow-up of 28 days or longer that were conducted between 1990 and 2003 were analyzed. These trials enrolled 13,772 patients, and participating patients comprised 23% of all patients enrolled in RCTs over the past 40 years; 61 (64%) trial arms were conducted in areas where the rate of malaria transmission was low, and 58 (50%) trial arms were supported by parasite genotyping to distinguish true recrudescences from reinfections. The median overall failure rate reported was 10% (range, 0 to 47%). The widely used day 14 assessment had a sensitivity of between 0 and 37% in identifying treatment failures and had no predictive value. Assessment at day 28 had a sensitivity of 66% overall (28 to 100% in individual trials) but could be used to predict the true failure rate if either parasite genotyping was performed (r(2) = 0.94) or if the entomological inoculation rate was known. In the assessment of drug efficacy against falciparum malaria, 28 days should be the minimum period of follow-up.
Figures
References
-
- Adjuik, M., P. Agnamey, A. Babiker, S. Borrman, P. Brasseur, M. Cisse, F. Cobelens, S. Diallo, J. F. Faucher, P. Garner, S. Gikunda, P. G. Kremsner, S. Krishna, B. Lell, M. Loolpapit, P. B. Matsiegui, M. A. Missinou, J. Mwanza, F. Ntoumi, P. Olliaro, P. Osimbo, P. Rezbach, E. Some, and W. R. Taylor. 2002. Amodiaquine-artesunate versus amodiaquine for uncomplicated Plasmodium falciparum malaria in African children: a randomized, multicentre trial. Lancet 359:1365-1372. - PubMed
-
- Adjuik, M., A. Babiker, P. Garner, P. Olliaro, W. Taylor, N. White, et al. 2004. Artesunate combinations for treatment of malaria: meta-analysis. Lancet 363:9-17. - PubMed
-
- Bloland, P. B., and M. Ettling. 1999. Making malaria-treatment policy in the face of drug resistance. Ann. Trop. Med. Parasitol. 93:5-23. - PubMed
-
- Brockman, A., R. E. Paul, T. J. Anderson, I. Hackford, L. Phaiphun, S. Looareesuwan, F. Nosten, and K. P. Day. 1999. Application of genetic markers to the identification of recrudescent Plasmodium falciparum infections on the northwestern border of Thailand. Am. J. Trop. Med. Hyg. 60:14-21. - PubMed
-
- Checchi, F., R. Durand, S. Balkan, B. T. Vonhm, J. Z. Kollie, P. Biberson, E. Baron, J. Le Bras, and J. P. Guthmann. 2002. High Plasmodium falciparum resistance to chloroquine and sulfadoxine-pyrimethamine in Harper, Liberia: results in vivo and analysis of point mutations. Trans. R. Soc. Trop. Med. Hyg. 96:664-669. - PubMed
Publication types
MeSH terms
Substances
Grants and funding
LinkOut - more resources
Full Text Sources
Miscellaneous
