

Convergence of excitatory and inhibitory hair cell transmitters shapes vestibular afferent responses
- PMID: 15505229
- PMCID: PMC524830
- DOI: 10.1073/pnas.0402824101
Convergence of excitatory and inhibitory hair cell transmitters shapes vestibular afferent responses
Abstract
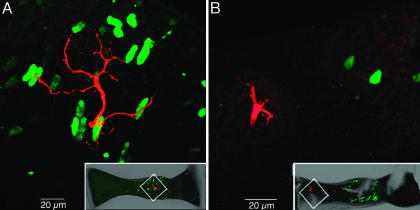
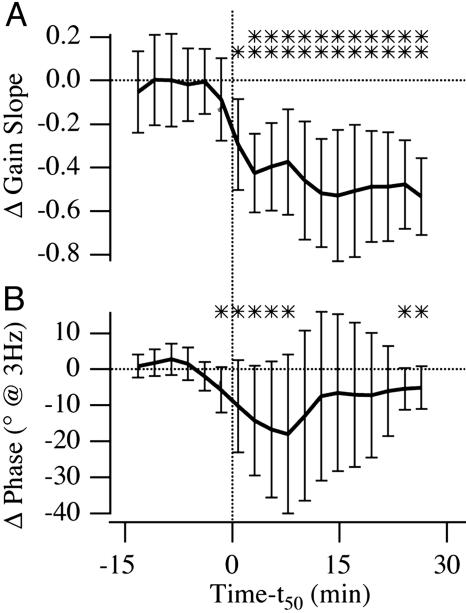
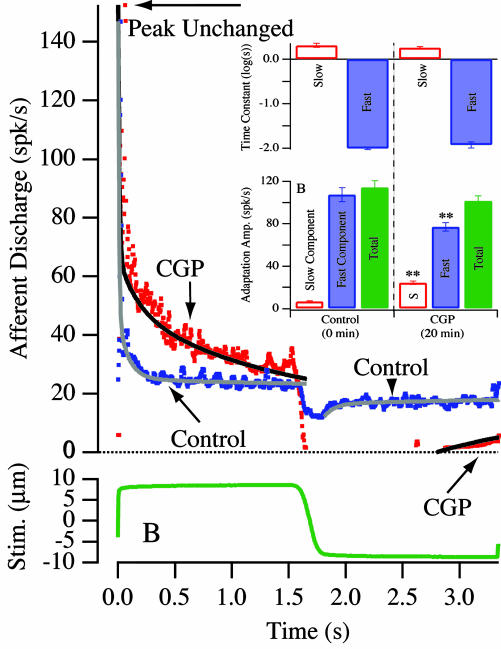
The vestibular semicircular canals respond to angular acceleration that is integrated to angular velocity by the biofluid mechanics of the canals and is the primary origin of afferent responses encoding velocity. Surprisingly, some afferents actually report angular acceleration. Our data indicate that hair-cell/afferent synapses introduce a mathematical derivative in these afferents that partially cancels the biomechanical integration and results in discharge rates encoding angular acceleration. We examined the role of convergent synaptic inputs from hair cells to this mathematical differentiation. A significant reduction in the order of the differentiation was observed for low-frequency stimuli after gamma-aminobutyric acid type B receptor antagonist administration. Results demonstrate that gamma-aminobutyric acid participates in shaping the temporal dynamics of afferent responses.
Figures


Similar articles
-
Determinants of spatial and temporal coding by semicircular canal afferents.J Neurophysiol. 2005 May;93(5):2359-70. doi: 10.1152/jn.00533.2004. J Neurophysiol. 2005. PMID: 15845995 Free PMC article. Review.
-
Determinants of semicircular canal afferent response dynamics in fish.Ann N Y Acad Sci. 1996 Jun 19;781:213-43. doi: 10.1111/j.1749-6632.1996.tb15703.x. Ann N Y Acad Sci. 1996. PMID: 8694417
-
Determinants of semicircular canal afferent response dynamics in the toadfish, Opsanus tau.J Neurophysiol. 1996 Feb;75(2):575-96. doi: 10.1152/jn.1996.75.2.575. J Neurophysiol. 1996. PMID: 8714636
-
Influence of surgical plugging on horizontal semicircular canal mechanics and afferent response dynamics.J Neurophysiol. 1999 Aug;82(2):1033-53. doi: 10.1152/jn.1999.82.2.1033. J Neurophysiol. 1999. PMID: 10444695
-
Basic organization principles of the VOR: lessons from frogs.Prog Neurobiol. 2004 Jul;73(4):259-309. doi: 10.1016/j.pneurobio.2004.05.003. Prog Neurobiol. 2004. PMID: 15261395 Review.
Cited by
-
Integrated mechanisms of anticipation and rate-of-change computations in cortical circuits.PLoS Comput Biol. 2007 May;3(5):e82. doi: 10.1371/journal.pcbi.0030082. Epub 2007 Mar 26. PLoS Comput Biol. 2007. PMID: 17500584 Free PMC article.
-
Infrared photostimulation of the crista ampullaris.J Physiol. 2011 Mar 15;589(Pt 6):1283-94. doi: 10.1113/jphysiol.2010.198333. Epub 2011 Jan 17. J Physiol. 2011. PMID: 21242259 Free PMC article.
-
Spontaneous and Acetylcholine Evoked Calcium Transients in the Developing Mouse Utricle.Front Cell Neurosci. 2019 May 7;13:186. doi: 10.3389/fncel.2019.00186. eCollection 2019. Front Cell Neurosci. 2019. PMID: 31133810 Free PMC article.
-
Low-intensity ultrasound activates vestibular otolith organs through acoustic radiation force.J Acoust Soc Am. 2017 Jun;141(6):4209. doi: 10.1121/1.4984287. J Acoust Soc Am. 2017. PMID: 28618821 Free PMC article.
-
Functional Organization of Vestibulo-Ocular Responses in Abducens Motoneurons.J Neurosci. 2017 Apr 12;37(15):4032-4045. doi: 10.1523/JNEUROSCI.2626-16.2017. Epub 2017 Mar 14. J Neurosci. 2017. PMID: 28292832 Free PMC article.
References
-
- Robinson, D. A. (1968) Science 161, 1279-1284.
-
- Raphan, T. & Cohen, B. (1996) in Handbook of Clinical Neuro-Otology: Disorders of the Vestibular System, eds. Baloh, R. W. & Halmagyi, G. M. (Oxford Univ. Press, London), Vol. 1, pp. 20-47.
-
- Steinhausen, W. (1933) Pflügers Arch. 232, 500-512.
-
- Rabbitt, R. D., Damiano, E. R. & Grant, J. W. (2003) in The Vestibular System, eds. Highstein, S. M., Popper, A. & Fay, R. (Spirnger, New York), pp. 153-201.
Publication types
MeSH terms
Substances
Grants and funding
LinkOut - more resources
Full Text Sources
Other Literature Sources
