. 2004 Nov;52(11):1447-57.
doi: 10.1369/jhc.3A6241.2004.

Spatial distribution and initial changes of SSEA-1 and other cell adhesion-related molecules on mouse embryonic stem cells before and during differentiation

Affiliations

Spatial distribution and initial changes of SSEA-1 and other cell adhesion-related molecules on mouse embryonic stem cells before and during differentiation

Li Cui et al. J Histochem Cytochem. 2004 Nov.

Abstract

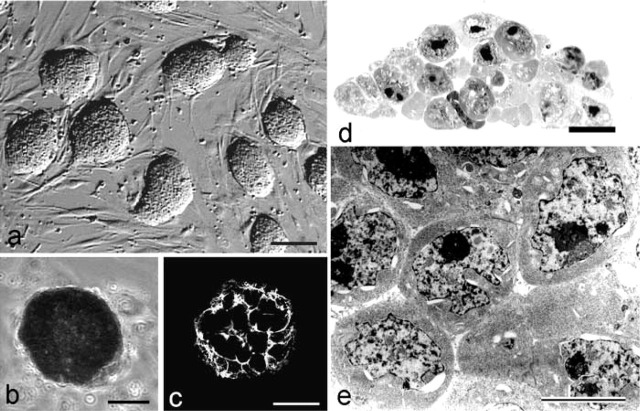
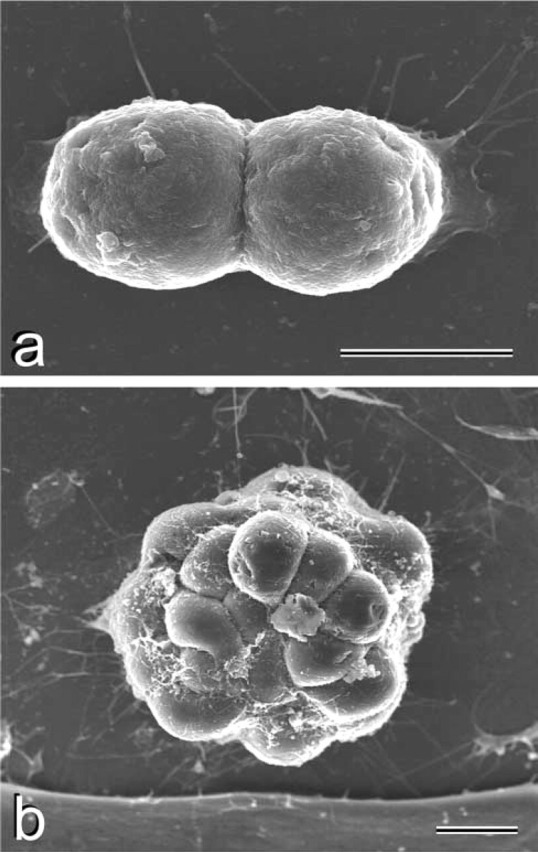
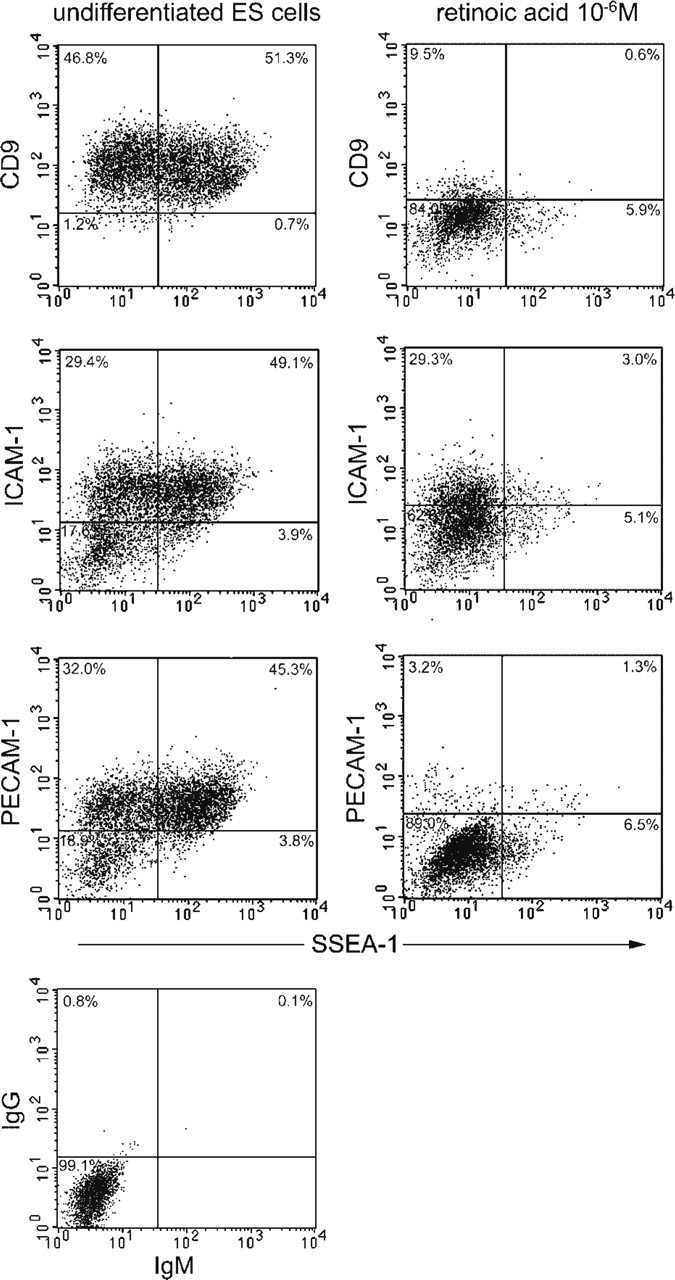
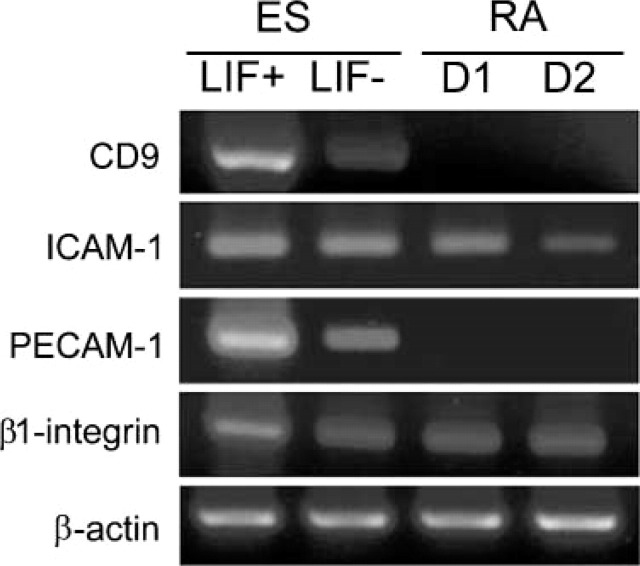
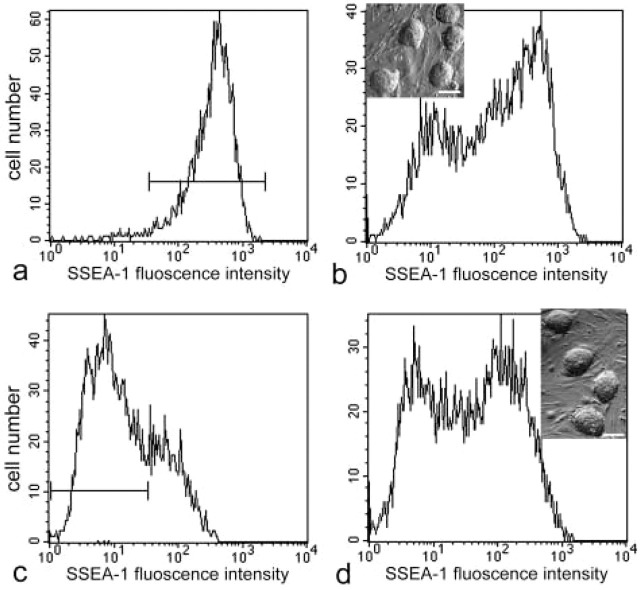
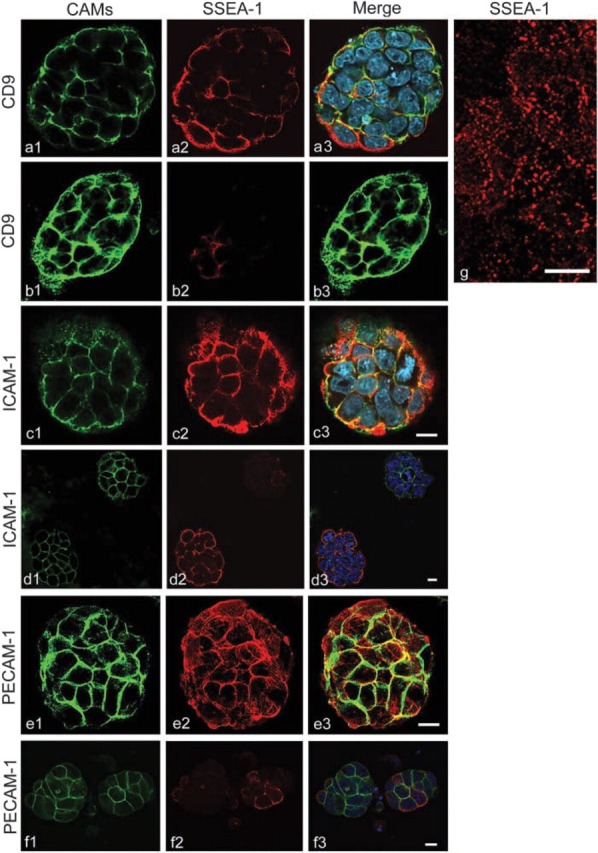
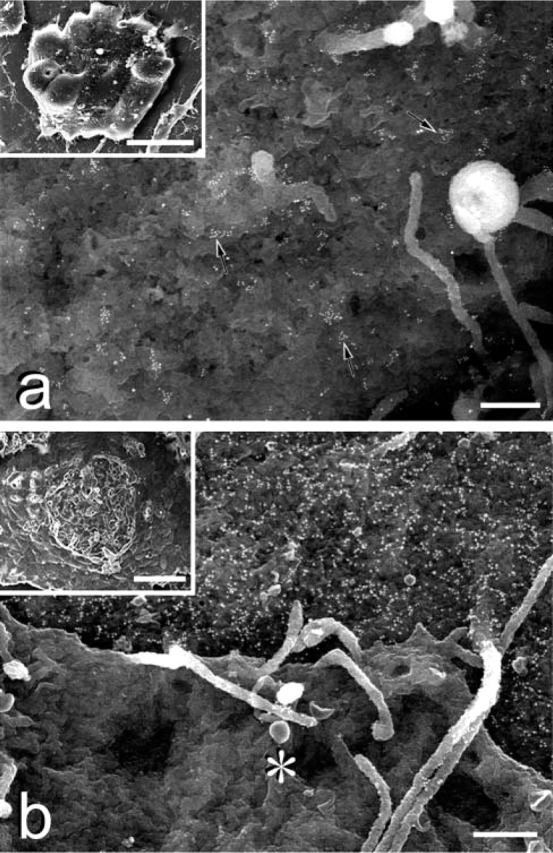
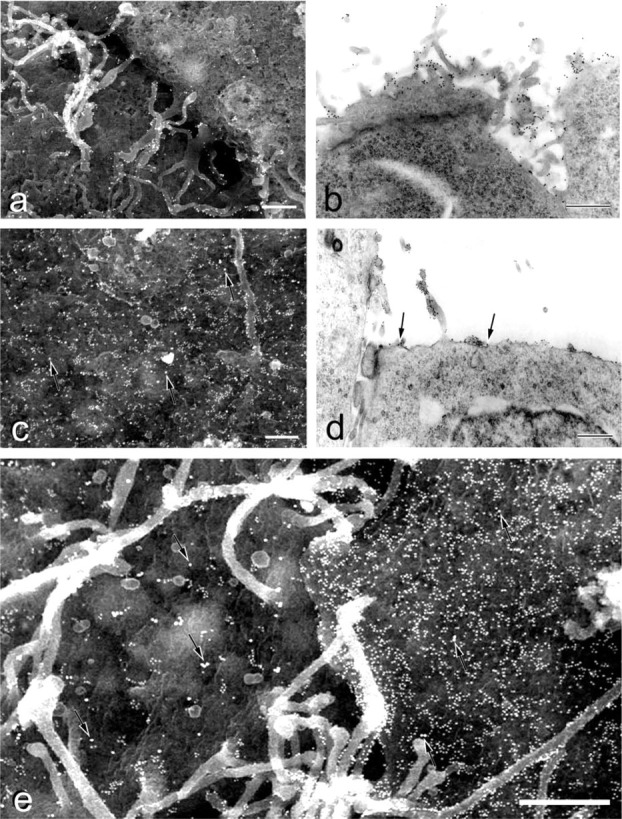
We examined the distribution of cell adhesion-related molecules (CAMs) among mouse embryonic stem (ES) cells and the spatial distribution on cell surfaces before and during differentiation. The cell-cell heterogeneity of SSEA-1, PECAM-1, and ICAM-1 among the undifferentiated cells in the ES cell colonies was evident by immunohistochemistry and immuno-SEM, supporting the flow cytometry findings. In contrast, most undifferentiated ES cells strongly expressed CD9. SSEA-1 was located preferentially on the edge of low protuberances and microvilli and formed clusters or linear arrays of 3-20 particles. PECAM-1 and ICAM-1 were randomly localized on the free cell surfaces, whereas CD9 was preferentially localized on the microvilli or protuberances, especially in the cell periphery. Both the SSEA-1(+) fraction and the SSEA-1(-) fraction of magnetic cell sorting (MACS) formed undifferentiated colonies after plating. Flow cytometry showed that these populations reverted separately again to a culture with a mixed phenotype. Differentiation induced by retinoic acid downregulated the expression of all CAMs. Immuno-SEM showed decreases of SSEA-1 in the differentiated ES cells, although some clustering still remained. Our findings help to elucidate the significance of these molecules in ES cell maintenance and differentiation and suggest that cell surface antigens may be useful for defining the phenotype of undifferentiated and differentiated ES cells.


Figures

Figure 1
Figure 1
Undifferentiated mouse ES cell colonies on culture day 2. (A) Hoffman modulation contrast image of mouse ES cell colonies. Within each colony, undifferentiated ES cells have indistinct margins. Bar = 100 μm. (B) ES colonies are positive for alkaline phosphatase activity. (C) Cells within the ES cell colony are positive for SSEA-1, a conventional marker for mouse undifferentiated ES cells. Bars = 60 μm. (D) Vertical section of an ES cell colony stained with toluidine blue. The colony displays compact morphology. Bar = 10 μm. (E) TEM image of an ES cell colony. The cells have a high nucleus/cytoplasm ratio and prominent nucleoli. The data for all figures is based on experiments with mouse ES 129/sv cells. Similar results were obtained for AB1, AB2.2, and DBA1 ES cells. Bar = 10 μm.
Figure 2
Figure 2
SEM images of mouse ES cell colonies. (A) Undifferentiated ES cells 12 hr after plating. Division of ES cell can be seen. (B) Undifferentiated ES colony on day 2. A well-formed three-dimensional colony has formed. The cell surfaces have microvilli and protuberances are observed. Bars = 10 μm.
Figure 3
Figure 3
Flow cytometry analysis for the expression of cell adhesion-related molecules on mouse ES cells in absence or presence of 10−6 M retinoic acid. Undifferentiated ES cells express CD9, ICAM-1, PECAM-1, and SSEA-1. The fluorescence intensity for SSEA-1 ranges from background level to strong in every plot of undifferentiated ES cells. Approximately half of the cells are SSEA-1-negative. The dot-plot patterns of ICAM-1 and PECAM-1 are similar to one another, with double-negative cells comprising 17.6% and 18.9% of the population, respectively. In contrast, almost all of the cells (98%) are CD9-positive. After treatment with 10−6 M retinoic acid, double-negative cells for SSEA-1 and ICAM-1, PCAM-1, or CD-9 clearly increased. The quads were set up on the control's dot-plot.
Figure 4
Figure 4
RT- PCR analysis for undifferentiated, partially differentiated (LIF-), and retinoic acid-treated ES cells. ES, undifferentiated ES cells; LIF+, culture in the ES medium with LIF. LIF-, control culture on day 1 in the ES medium without LIF; RA D1 and D2, differentiated ES cells on culture days 1 and 2 with retinoic acid. After withdrawal of LIF, differentiation of ES cells initiates but is slow compared with retinoic acid treatment.
Figure 5
Figure 5
Reversibility of SSEA-1-positive and -negative cells. (A) The purity of freshly isolated SSEA-1 positive cells was 98.6%. (B) Three days after plating the SSEA-1+ fraction, an SSEA-1 cell population emerged again in undifferentiated ES colonies. (Inset) ES cell colonies derived from SSEA-1+ fraction were morphologically similar to those before MACS. Bar = 50 μm. (C) The purity of freshly isolated SSEA-1 cells was 78.2%. (C) Three days after plating the SSEA-1 fraction, the percentage of SSEA-1 cells was reduced, whereas the percentage of SSEA-1+ cells recovered to the same level as that before sorting. (Inset) ES cell colonies derived from the SSEA-1 fraction were morphologically similar to those before MACS.
Figure 6
Figure 6
CLSM images of undifferentiated mouse ES cell colonies double stained for SSEA-1 and CD9, ICAM-1, or PECAM-1. Figures labeled 1, 2, and 3 are specific for CAM alone (green), SSEA-1 alone (red), and double-stained (red and green), respectively. Nuclei are stained with DAPI (blue). SSEA-1 is localized to cell-cell contact sites and on free surfaces (a-f2, −3, and g). Not all cells express SSEA-1 (b2,b3,d2,d3,f2,f3). CD9 (a1,a3,b1,b3) is also localized to cell-cell contact sites along with SSEA-1, but its expression there is not dependent on SSEA-1 (b1-b3). CD9 is also found on free cell surfaces apart from cell-cell contact sites. ICAM-1 (c1,c3,d1,d3) has a similar distribution as CD9. PECAM-1 is also similar except that it is less apparent on the free cell surfaces (e1,e3). Not all PECAM-1-positive cells express SSEA-1 (F). High magnification (G) shows the dot-like distribution of SSEA-1 on the surface of ES cells. Bars = 10 μm.
Figure 8
Figure 8
Immunoelectron microscopic images of retinoic acid-treated mouse ES cells. (A) Retinoic acid decreases SSEA-1 labeling; however, some dot-like clusters of SSEA-1 (arrows) still remain. Bar = 0.5 μm. (Inset) ES colony cultured with retinoic acid for 2 days. Morphological alteration is evident compared with the undifferentiated ES cell colonies. The colony has become flat. Bar = 20 μm. (B) Control staining with SSEA-1 on the embryoid body outgrowth. (Inset) The surface cell layer has clearly differentiated to epitheliumlike cells, under which some undifferentiated ES cells still remain. The surface epithelium-like cells at the center have been mechanically stripped off, exposing the underlying cells. Bar = 40 μm. BSE shows the underlying undifferentiated ES cell is positive for SSEA-1, identical to the cells in undifferentiated colonies. The differentiated epithelium-like cells () are SSEA-1-negative. Bar = 0.5 μm.
Figure 7
Figure 7
Immuno-EM images of undifferentiated mouse ES cells. (a, c, e) BSE images; (b, d) TEM images. (A) CD9 (single staining) is restricted to the microvilli and low protuberances of cell boundary. (B) In the cell boundary, preferential distribution of the gold particles for CD9 is evident. (c-e) Double staining for SSEA-1 (10-nm gold) and ICAM-1 or PECAM-1 (20-nm gold; arrows). ICAM-1 (c, d) and PECAM-1 (E) are randomly distributed on the free surfaces of undifferentiated ES cells. The small gold particles for SSEA-1 are in linear arrays along the cell protuberances and microvilli. Cell-cell heterogeneity of SSEA-1 is noticeable (E). Bars = 0.5 μm.

References

    1. Belaaloui G, Imbert AM, Bardin F, Tonnelle C, Dubreuil P, Lopez M, Chabannon C. (2003) Functional characterization of human CD34+ cells that express low or high levels of the membrane antigen CD111 (nectin 1). Leukemia 17:1137–1145 - PubMed
    1. Berditchevski F, Odintsova E. (1999) Characterization of integrin-tetraspanin adhesion complexes: role of tetraspanins in integrin signaling. J Cell Biol 146:477–492 - PMC - PubMed
    1. Bird JM, Kimber SJ. (1984) Oligosaccharides containing fucose linked alpha (1–3) and alpha(1–4) to N-acetylglucosamine cause decompaction of mouse morulae. Dev Biol 104:449–460 - PubMed
    1. Connolly DT, Townsend RR, Kawaguchi K, Bell WR, Lee YC. (1982) Binding and endocytosis of cluster glycosides by rabbit hepatocytes. Evidence for a short-circuit pathway that does not lead to degradation. J Biol Chem 257:939–945 - PubMed
    1. Cook GA, Longhurst CM, Grgurevich S, Cholera S, Crossno JT, Jr, Jennings LK. (2002) Identification of CD9 extracellular domains important in regulation of CHO cell adhesion to fibronectin and fibronectin pericellular matrix assembly. Blood 100:4502–4511 - PubMed

Publication types

MeSH terms