. 2004 Nov;78(22):12537-47.
doi: 10.1128/JVI.78.22.12537-12547.2004.

Murine T cells potently restrict human immunodeficiency virus infection

Affiliations

Murine T cells potently restrict human immunodeficiency virus infection

Jörg G Baumann et al. J Virol. 2004 Nov.

Abstract

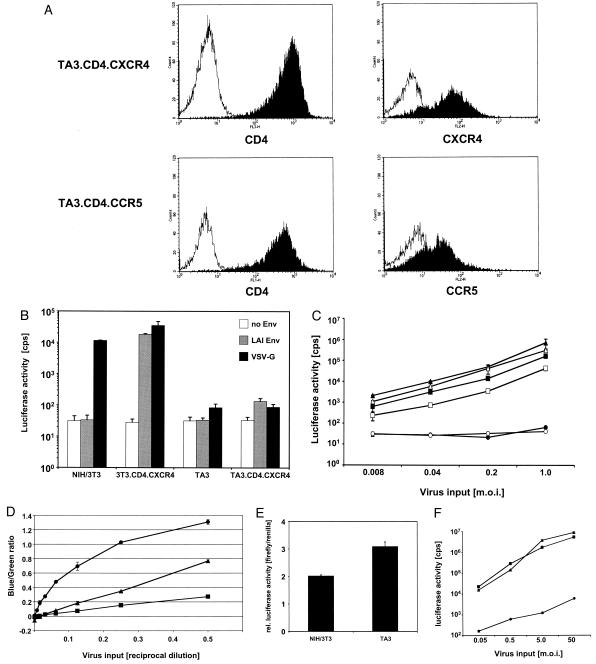
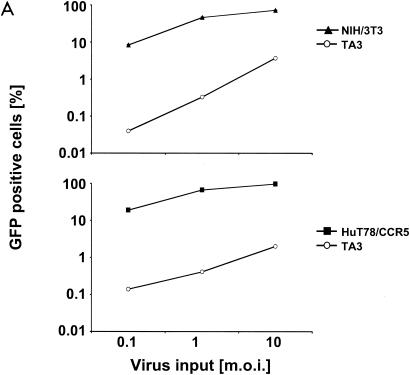
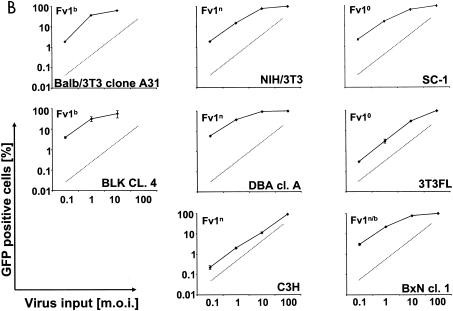
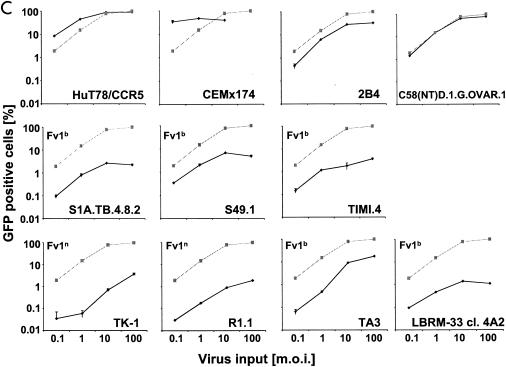
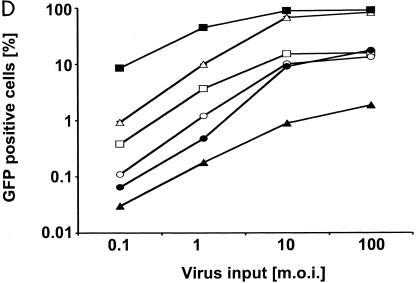
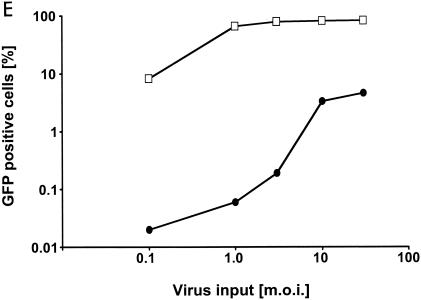
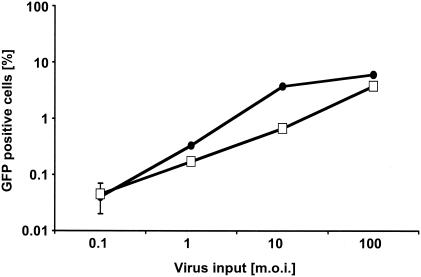
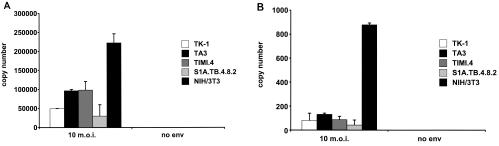
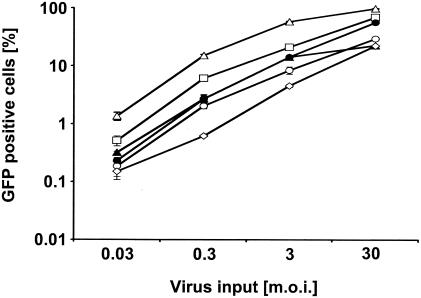
Development of a mouse model for human immunodeficiency virus type 1 (HIV-1) infection has advanced through the progressive identification of host cell factors required for HIV-1 replication. Murine cells lack HIV-1 receptor molecules, do not support efficient viral gene expression, and lack factors necessary for the assembly and release of virions. Many of these blocks have been described using mouse fibroblast cell lines. Here we identify a postentry block to HIV-1 infection in mouse T-cell lines that has not been detected in mouse fibroblasts. While murine fibroblastic lines are comparable to human T-cell lines in permissivity to HIV-1 transduction, infection of murine T cells is 100-fold less efficient. Virus entry occurs efficiently in murine T cells. However, reduced efficiency of the completion of reverse transcription and nuclear transfer of the viral preintegration complex are observed. Although this block has similarities to the restriction of murine retroviruses by Fv1, there is no correlation of HIV-1 susceptibility with cellular Fv1 genotypes. In addition, the block to HIV-1 infection in murine T-cell lines cannot be saturated by a high virus dose. Further studies of this newly identified block may lend insight into the early events of retroviral replication and reveal new targets for antiretroviral interventions.


Figures

FIG. 1.
FIG. 1.
Murine TA3 cells restrict HIV infection. (A) Expression of human CD4, CXCR4, and CCR5 on TA3.CD4.CXCR4 cells (top) and TA3.CD4.CCR5 cells (bottom). The cells were stained with monoclonal antibodies against human CD4, CXCR4, and CCR5. CD4 is shown in the left panels, and coreceptor molecules are in the right panels. Isotype control stainings are represented by the unfilled curves for comparison. (B) Comparison of the transduction efficiency of HIV-1 vectors on murine NIH 3T3 fibroblasts and murine TA3 cells expressing human CD4 and human CXCR4. Predicted MOIs of 0.4 (NIH 3T3) and 2 (TA3) were used in the challenges depicted. Env-negative virus was generated in parallel transfections, and comparable volumes were used in the infections. NIH 3T3, NIH 3T3.CD4.CXCR4, TA3, and TA3.CD4.CXCR4 were challenged with HIVluc without envelope, pseudotyped with LAI Env, or VSV-G. Three days after infection luciferase activity was assayed. Luciferase counts per second (cps) are indicated on the ordinate (logarithmic scale). (C) Restriction is independent of envelope properties. NIH 3T3.CD4.CCR5 (triangles), HuT78/CCR5 (squares), and TA3.CD4.CCR5 (circles) cells were challenged with increasing amounts of HIVluc/ADA (open symbols) and HIVluc/VSV-G (solid symbols). Three days after challenge, infections were assayed by measuring luciferase activity, which is shown as a function of virus input (MOI). Each point represents the average of duplicate samples and is depicted with the standard deviation. (D) Entry of HIV/VSV-G into murine T cells, murine fibroblasts, and human T cells. TA3 (circles), NIH 3T3 (triangles), and HuT78/CCR5 (squares) cells were challenged in a twofold dilution series with HIVRP/VSV-G incorporating β-lactamase (BlaM) fused to Vpr. The cells were then loaded with the BlaM substrate CCF4-AM, which forms a 460 nm (blue) fluorescent product in the presence of BlaM. The 538 nm (green) fluorescent cells are negative for virus penetration. The ratio of blue fluorescence to green fluorescence is proportional to the fraction of cells that have fused with the HIVRP. (E) Comparison of LTR promoter to SV40 promoter activity in murine T cells and fibroblasts. NIH 3T3 and TA3 cells were cotransfected with the vector plasmid pHIVluc (expressing luciferase under transcriptional control of the HIV-1 LTR) and pRL-SV40 (expressing Renillaluciferase under transcriptional control of the SV40 promoter) in a ratio of 4:1, and the activities of firefly luciferase and Renilla luciferase were measured. The y axis shows the ratio of firefly luciferase (cps) over Renilla luciferase (cps) activity in a mean of two transfected wells, each measured in triplicate. (F) Challenge with a vector carrying an internal SV40 promoter. NIH 3T3 (triangles), HuT78/CCR5 (squares), and TA3 (circles) cells were challenged with increasing amounts of HIV-SVluc (carrying the firefly luciferase reporter gene under transcriptional control of the SV40 promoter) pseudotyped with VSV-G. Infections were assayed by measuring luciferase activity, which is shown as a function of virus input (MOI). Each point represents the average of duplicate samples and is depicted with the standard deviation.
FIG. 2.
FIG. 2.
Infection of murine fibroblasts, T cells, and B cells with HIVeGFP/VSV-G. Ten-fold serial dilutions of HIVeGFP pseudotyped with VSV-G were used to infect lymphocytic and fibroblast lines (105 cells each). Three days after challenge, GFP expression in infected cells was measured using flow cytometry. Infections (percent GFP-positive cells) are shown as a function of virus input (MOI) on a logarithmic scale. (A) Comparison of human T cells (HuT78/CCR5), mouse fibroblasts (NIH 3T3), and mouse T cells (TA3) for susceptibility to HIV-1. (B) Infection of fibroblasts from mouse strains expressing different Fv1 alleles. A fixed reference curve (grey line) is included in all plots. (C) Challenge of mouse T-cell lines, two human lymphocytic cell lines (HuT78/CCR5 and CEMx174), the mouse T-cell hybridoma 2B4, and rat T cells C58(NT)D.1.G.OVAR.1 (top row, from left to right). Infection of NIH 3T3 fibroblasts is included as a light grey reference curve in all plots. (D) Challenge of mouse B-cell lines. Mouse B-lymphocytic cell lines WEHI-231 (open triangles), 22D6 (open circles), 143-2 M (open squares), and 1881 (solid triangles) were challenged with HIVeGFP/VSV-G and compared to HuT78/CCR5 (solid squares) and TA3 (solid circles) cells. (E) Infection of primary mouse CD4+ T cells (D10; solid circles) and human HuT78/CCR5 cells (open squares) with HIVeGFP/VSV-G at various MOIs.
FIG. 2.
FIG. 2.
Infection of murine fibroblasts, T cells, and B cells with HIVeGFP/VSV-G. Ten-fold serial dilutions of HIVeGFP pseudotyped with VSV-G were used to infect lymphocytic and fibroblast lines (105 cells each). Three days after challenge, GFP expression in infected cells was measured using flow cytometry. Infections (percent GFP-positive cells) are shown as a function of virus input (MOI) on a logarithmic scale. (A) Comparison of human T cells (HuT78/CCR5), mouse fibroblasts (NIH 3T3), and mouse T cells (TA3) for susceptibility to HIV-1. (B) Infection of fibroblasts from mouse strains expressing different Fv1 alleles. A fixed reference curve (grey line) is included in all plots. (C) Challenge of mouse T-cell lines, two human lymphocytic cell lines (HuT78/CCR5 and CEMx174), the mouse T-cell hybridoma 2B4, and rat T cells C58(NT)D.1.G.OVAR.1 (top row, from left to right). Infection of NIH 3T3 fibroblasts is included as a light grey reference curve in all plots. (D) Challenge of mouse B-cell lines. Mouse B-lymphocytic cell lines WEHI-231 (open triangles), 22D6 (open circles), 143-2 M (open squares), and 1881 (solid triangles) were challenged with HIVeGFP/VSV-G and compared to HuT78/CCR5 (solid squares) and TA3 (solid circles) cells. (E) Infection of primary mouse CD4+ T cells (D10; solid circles) and human HuT78/CCR5 cells (open squares) with HIVeGFP/VSV-G at various MOIs.
FIG. 3.
FIG. 3.
Infection of TA3 cells after pretreatment with a second HIV-1 vector. TA3 cells were inoculated with serial dilutions of HIVeGFP/VSV-G. In one infection set, the cells were pretreated with HIV-HSA/VSV-G (open squares) at a predicted MOI of 100. Parallel infections were performed without pretreatment (solid circles). HIVeGFP/VSV-G virus input is shown on a logarithmic scale on the abscissa, and the percentage of infected cells as measured by GFP expression in flow cytometry is represented on the ordinate.
FIG. 4.
FIG. 4.
HIV-1 reverse transcription is less efficient in murine T cells. TK-1, TA3, TIMI.4, S1A.TB.4.8.2, and NIH 3T3 cells were challenged with an MOI of 10 using HIVeGFP/VSV-G and HIVeGFP (without Env). Real-time PCR was used to quantify reverse transcription products. Copy numbers of late reverse transcription (second-strand transfer) products (A) and 2-LTR circle junctions (B) are indicated on the y axes.
FIG. 5.
FIG. 5.
MLVeGFP infection of murine fibroblasts and T cells. Tenfold dilutions of ecotropic MoMLV vector pseudotypes encoding a GFP cassette were used to infect NIH 3T3 (open triangles), 2B4 (open squares), S49.1 (solid triangles), TA3 (solid circles), S1A.TB.4.8.2 (open circles), and TIMI.4 (open diamonds) cells. GFP expression was assayed using flow cytometry 3 days postinfection. Infections (percent GFP; y axis) are shown as a function of virus input (MOI; x axis).

References

    1. Aagaard, L., J. G. Mikkelsen, S. Warming, M. Duch, and F. S. Pedersen. 2002. Fv1-like restriction of N-tropic replication-competent murine leukaemia viruses in mCAT-1-expressing human cells. J. Gen. Virol. 83:439-442. - PubMed
    1. Aaronson, S. A., and G. J. Todaro. 1968. Development of 3T3-like lines from Balb-c mouse embryo cultures: transformation susceptibility to SV40. J. Cell Physiol. 72:141-148. - PubMed
    1. Benjers, B. M., R. H. Bassin, A. Rein, B. I. Gerwin, and G. Duran-Troise. 1979. Mechanism of restriction of murine leukemia viruses varies between different strains of Fv-1n mice. Int. J. Cancer 24:600-607. - PubMed
    1. Besnier, C., Y. Takeuchi, and G. Towers. 2002. Restriction of lentivirus in monkeys. Proc. Natl. Acad. Sci. USA 99:11920-11925. - PMC - PubMed
    1. Best, S., P. Le Tissier, G. Towers, and J. P. Stoye. 1996. Positional cloning of the mouse retrovirus restriction gene Fv1. Nature 382:826-829. - PubMed

Publication types

LinkOut - more resources