. 2004 Nov;87(5):3122-36.
doi: 10.1529/biophysj.103.039487.

Functional characterization of a small conductance GIRK channel in rat atrial cells

Affiliations

Functional characterization of a small conductance GIRK channel in rat atrial cells

Emil N Nikolov et al. Biophys J. 2004 Nov.

Erratum in

  • Biophys J. 2005 Jan;88(1):757

Abstract

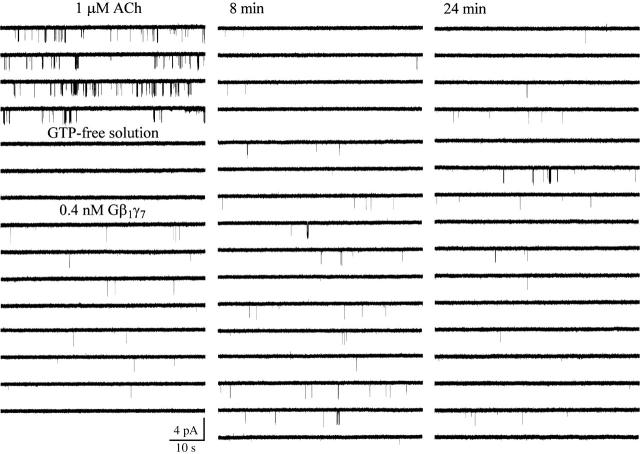
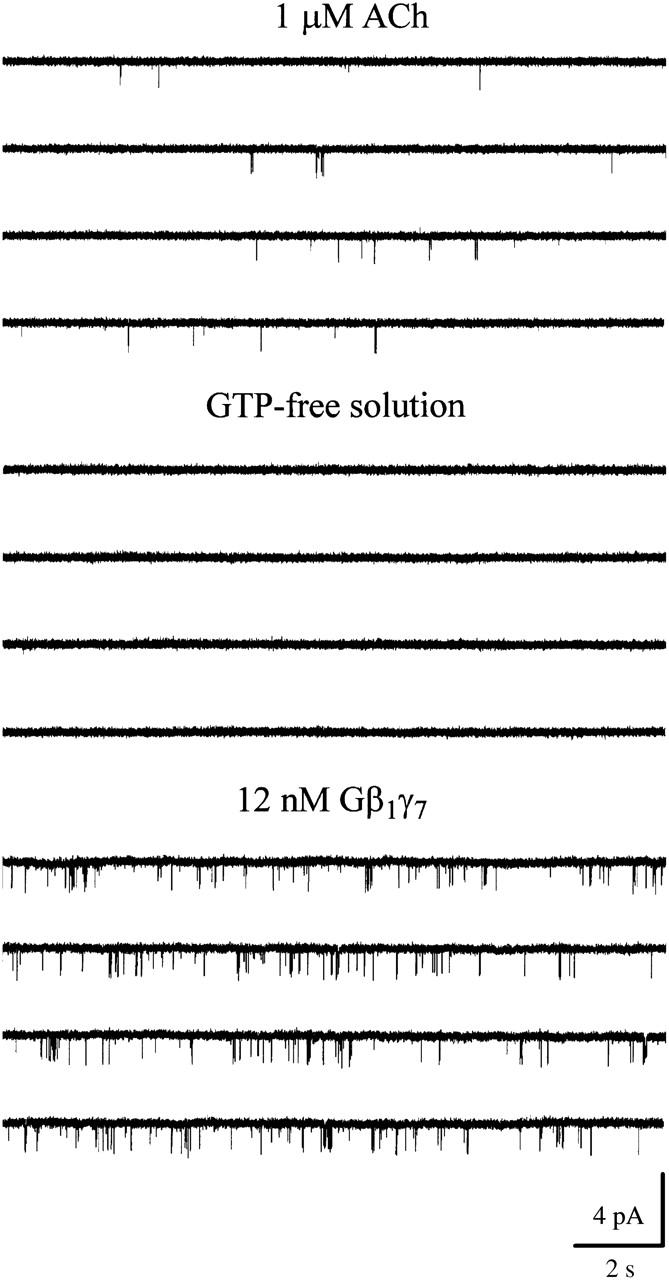
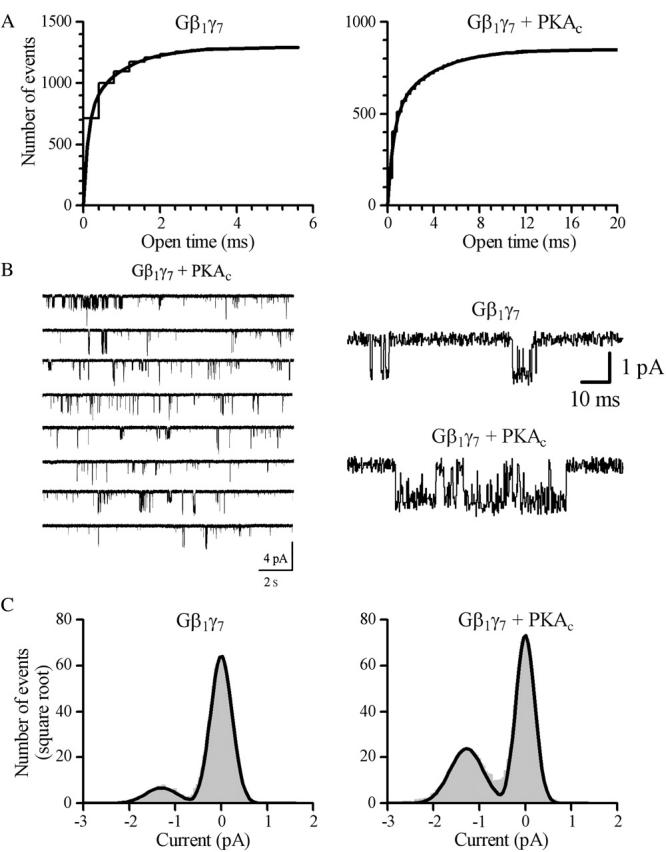
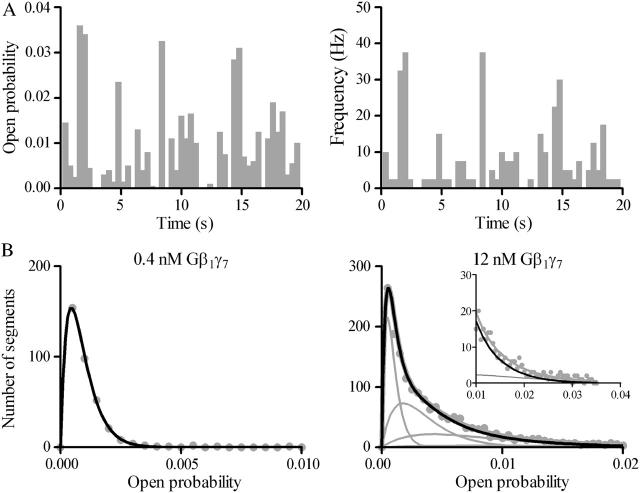
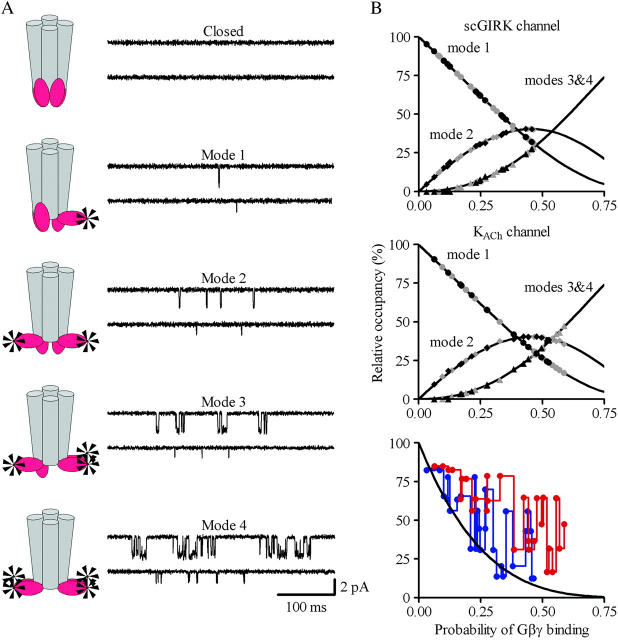
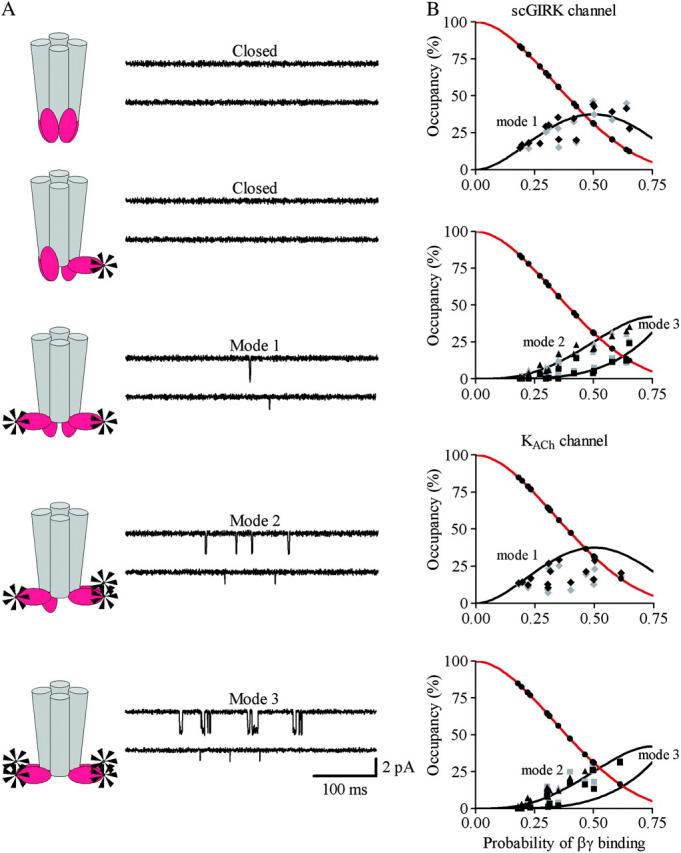
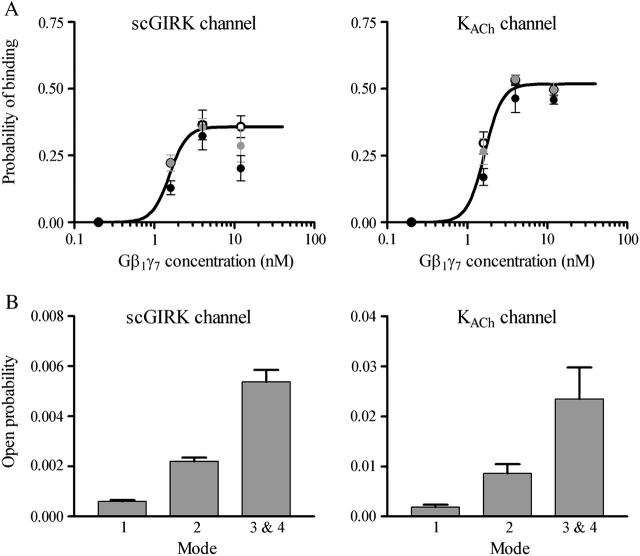
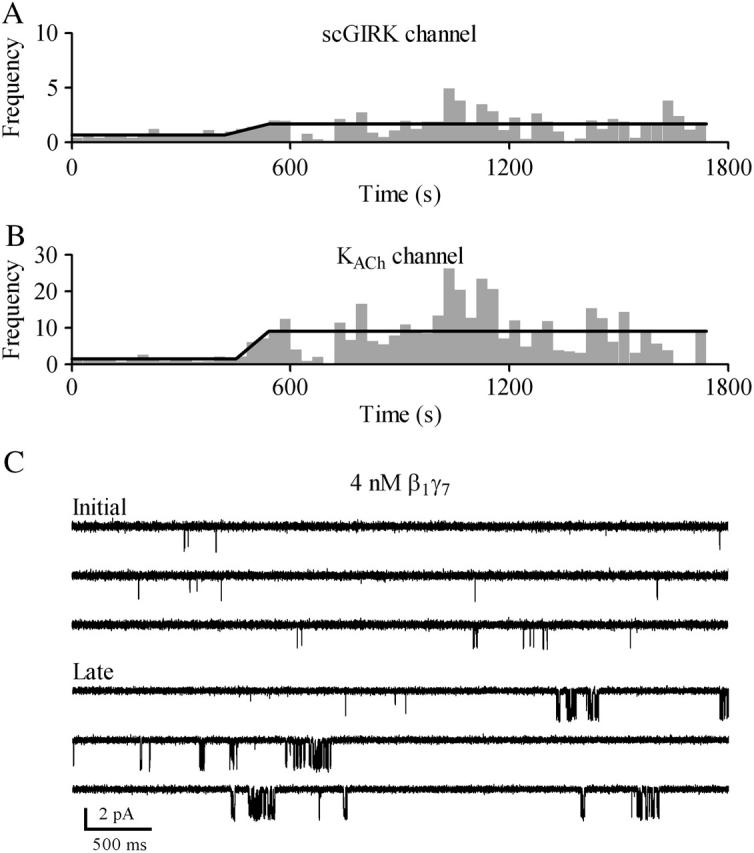
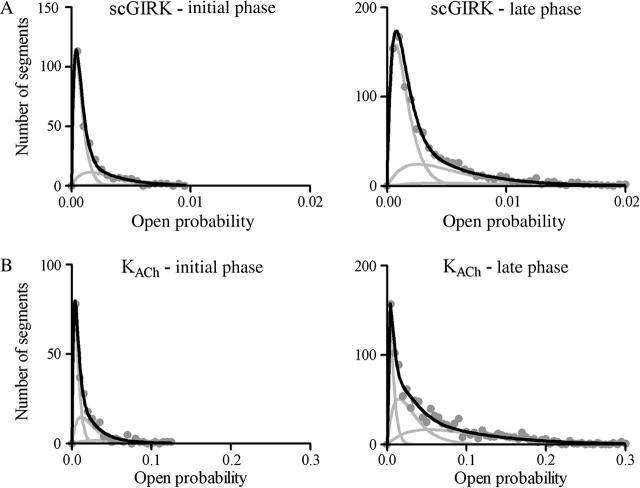
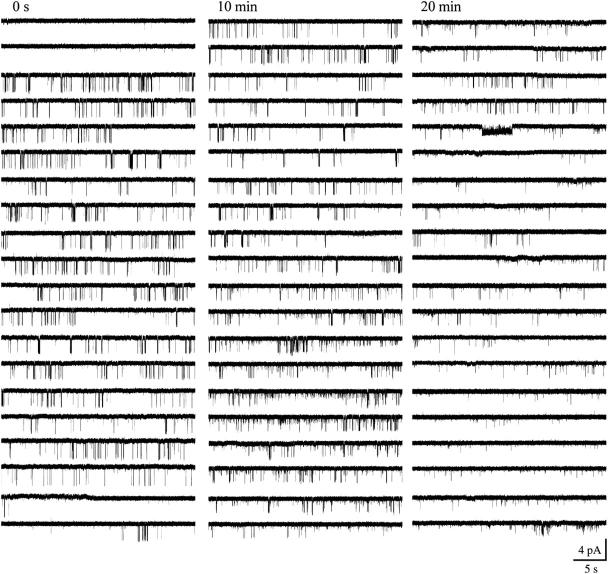
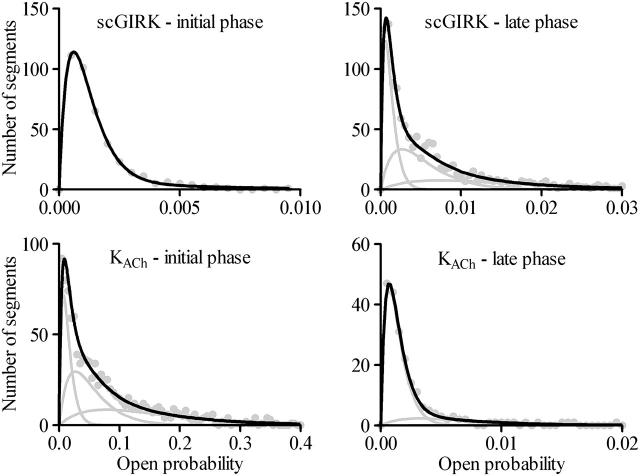
Muscarinic K+ (KACh) channels are key determinants of the inhibitory synaptic transmission in the heart. These channels are heterotetramers consisting of two homologous subunits, G-protein-gated inwardly rectifying K+ (GIRK)1 and GIRK4, and have unitary conductance of approximately 35 pS with symmetrical 150 mM KCl solutions. Activation of atrial KACh channels, however, is often accompanied by the appearance of openings with a lower conductance, suggesting a functional heterogeneity of G-protein-sensitive ion channels in the heart. Here we report the characterization of a small conductance GIRK (scGIRK) channel present in rat atria. This channel is directly activated by Gbetagamma subunits and has a unitary conductance of 16 pS. The scGIRK and KACh channels display similar affinities for Gbetagamma binding and are frequently found in the same membrane patches. Furthermore, Gbetagamma-activated scGIRK channels--like their KACh counterparts--exhibit complex gating behavior, fluctuating among four functional modes conferred by the apparent binding of a different number of Gbetagamma subunits to the channel. The electrogenic efficacy of the scGIRK channels, however, is negligible compared to that of KACh channels. Thus, Gbetagamma subunits employ the same signaling strategy to regulate two ion channels that are apparently endowed with very different functions in the atrial membrane.


Figures

FIGURE 1
FIGURE 1
Two populations of G-protein-activated single-channel openings in neonatal rat atrial myocytes. Activation of a single 34-pS KACh channel in a cell-attached patch is accompanied by the appearance of 16-pS openings. In this and all following figures, the downward deflections correspond to inward currents. Membrane potential: −90 mV; 1 μM ACh is added to the pipette solution. Excision of the membrane patch in GTP-free solution instantaneously and completely eliminated both 16- and 34-pS events. The membrane potential continued to be clamped at −90 mV during the entire experiment. Perfusion of the experimental chamber with 0.4 nM Gβ1γ7 restored both the 16- and 34-pS single-channel openings. The single-channel recording in the presence of Gβ1γ7 begins 10 min after Gβ1γ7 application.
FIGURE 2
FIGURE 2
Small conductance atrial GIRK channel. Single-channel activity recorded in cell-attached configuration from an atrial myocyte in the presence of 1 μM ACh. Channel activity ceased after patch excision in GTP-free solution. Application of 12 nM Gβ1γ7 restored the channel activity. Membrane potential: −90 mV.
FIGURE 3
FIGURE 3
Voltage dependence of scGIRK and KACh channels. (A) Gβ1γ7-activated single-channel currents were recorded from the same membrane patch at the indicated potentials. All-points histograms were generated from the recordings and fitted by a sum of Gaussian functions to determine the mean current amplitudes. (B) I−V curves for the scGIRK (gray) and KACh (black) channels were constructed from the single-channel current amplitudes determined at each membrane potential. Each data point represents the mean ± SEM of currents recorded from 5 to 14 channels.
FIGURE 4
FIGURE 4
Characteristics of scGIRK channels. (A) Cumulative open-time distributions with superimposed fits are shown for two different scGIRK channels activated by 4 nM Gβ1γ7 in the absence (left panel) and presence (right panel) of Mg-ATP/PKAc (the scGIRK channel shown in B). Membrane potential: −90 mV. Two exponential components were readily identified in both histograms. The time constants of the fast and slow components are τo1 = 0.12 ms (57.7%) and τo2 = 0.94 ms (42.3%) in the presence of Gβ1γ7 alone, and τo1 = 0.49 ms (55.3%) and τo2 = 3.49 ms (44.7%) in the presence of Gβ1γ7/Mg-ATP/PKAc. The relative areas of individual components are given in parentheses. (B) Effect of PKA on scGIRK channel gating. A pair of an scGIRK and a KACh channel residing in the same membrane patch was activated in the presence of 4 nM Gβ1γ7, and then PKAc was applied to the cytoplasmic side of the patch in the presence of Mg-ATP. Application of PKA triggered clustering of scGIRK channel openings into long bursts of activity. Expanded current traces recorded from the same patch before and after application of PKA are shown in the right panel to illustrate the kinetic behavior of the channel in greater detail. (C) All-points histograms generated from data recorded from the same scGIRK channel in the presence of Gβγ (left panel) and Gβγ/Mg-ATP/PKAc (right panel). The histograms were fitted by the sum of two Gaussian functions to determine the unitary conductance of scGIRK channel (14.4 pS and 14.2 pS, respectively).
FIGURE 5
FIGURE 5
Classification of the scGIRK channel gating. (A) Continuous single-channel recordings were divided into consecutive 400-ms segments and the channel open probability and the frequency of openings were determined for the individual segments. Plots of open probability (left panel) and frequency of gating (right panel) versus time, derived from the initial 20 s of the scGIRK channel recording illustrated in Fig. 2, are shown to illustrate the heterogeneous channel behavior. (B) Modal classification of scGIRK channel gating. Open probability histograms generated from scGIRK channel activity recorded at two different Gβ1γ7 concentrations. The histogram shown at left was generated from pooled data recorded from four different scGIRK channels activated in the presence of 0.4 nM Gβ1γ7. The histogram shown at right was generated from data recordings from a single scGIRK channel activated in the presence of 12 nM Gβ1γ7. The histograms shown in this and the following figures leave out the blank 400-ms data segments and include the active data segments only. The po histograms were fitted by a sum of gamma components formula image to determine the mean po values and the relative occupancy of different gating components. The mean po values and relative areas (given in parentheses) of different components are po1 = 0.00045 (100%) in the presence of 0.4 nM Gβ1γ7; and po1 = 0.00046 (29.3%), po2 = 0.0018 (37.7%), po3 = 0.0043 (27.2%), and po4 = 0.0085 (5.8%) in the presence of 12 nM Gβ1γ7. The inset shows the right part of the histogram on a different scale to illustrate the minor contribution of the component representing mode 4 (gray line) to the total fit of the histogram. This component was frequently too small to be accurately distinguished from the component representing mode 3, and therefore, modes 3 and 4 were analyzed together in the po histograms.
FIGURE 6
FIGURE 6
Gating equilibrium among four functional modes of GIRK channels. (A) A model assuming four functional modes of GIRK channels rendered active by the independent binding of an increasing number of Gβγ subunits to four equivalent Gβγ sensors in the channel structure. (B) For each channel, the relative occupancy of different gating modes was estimated from the fraction of the po (gray symbols) and f (black symbols) histograms fitted by the corresponding gamma components. The sojourns of the channels to gating modes 3 and 4 are jointly represented. In each experiment, the probability of Gβ1γ7-binding to one of the Gβγ sensors, P, was computed from the relative occupancy of mode 1, F1, according to Eq. 2. The solid lines represent the predicted occupancy of the individual gating modes. The symbols represent the occupancy of mode 1 (circles), mode 2 (diamonds), and modes 3 and 4 (triangles) determined from the individual po and f distributions for different scGIRK (n = 14) and KACh (n = 14) channels. The graph in panel B, bottom, illustrates the discrepancy between the predicted occupancy of mode 0 and the experimentally determined fractions of blank data segments for the scGIRK (blue) and KACh (red) channels.
FIGURE 7
FIGURE 7
Gating equilibrium among three functional modes of GIRK channels. (A) A model assuming three functional modes of GIRK channels rendered active by the independent binding of two, three, and four Gβγ subunits to four equivalent Gβγ sensors in the channel structure. (B) For each channel, the relative occupancy of different gating modes was estimated from the fraction of the po (gray symbols) and f (black symbols) histograms fitted by the corresponding gamma components. In each experiment, the probability of Gβ1γ7-binding to one of the Gβγ sensors, P, was computed from the relative occupancy of mode 0, F0, according to the equation: F0 = 4P(1 − P)3 + (1 − P)4 (red line). The solid lines represent the predicted occupancy of the individual gating modes. The symbols represent the occupancy of mode 1 (diamonds), mode 2 (triangles), and mode 3 (squares) determined from the individual po and f distributions for different scGIRK (n = 14) and KACh (n = 14) channels.
FIGURE 8
FIGURE 8
Comparison of the Gβ1γ7 affinity and electrogenic efficacy of the scGIRK and KACh channels. (A) Gβ1γ7 binding to scGIRK and KACh channels. The probability of Gβ1γ7 binding, P, is plotted against Gβ1γ7 concentration for the scGIRK (left panel) and KACh (right panel) channels. The parameter P was estimated at three standard time points of each experiment: 10 (black circle), 20 (gray circle) and 30 (empty circle) min after Gβ1γ7 perfusion. The points and error bars represent the mean ± SEM of four to six separate experiments. The solid lines through the data represent the least-squares fit with the Hill equation (Eq. 3), with a Hill coefficient, N, of 4 for both channels. The Pmax constant is 0.52 for the KACh channel and 0.36 for the scGIRK channel, whereas the dissociation constant Kd is 1.65 nM for the KACh channel and 1.55 nM for the scGIRK channel. (B) Open probability of different gating modes. The mean open probabilities determined from the analysis of scGIRK po histograms (left panel) are po1 = 0.00060 ± 0.00006, po2 = 0.0022 ± 0.0002, and po3&4 = 0.0054 ± 0.0005. The values for the KACh channel functional modes (right panel) are po1 = 0.0019 ± 0.0005, po2 = 0.0086 ± 0.0018, and po3&4 = 0.0234 ± 0.0063. Data are mean ± SEM (n = 10–14).
FIGURE 9
FIGURE 9
Synchronized slow modal transitions in GIRK channel gating. Single-channel recordings from a pair of scGIRK and KACh channel activated by 4 nM Gβ1γ7. After an initial period (∼7 min) of steady gating, the activity of both channels increased simultaneously.
FIGURE 10
FIGURE 10
Biphasic activation of GIRK channels. Time courses of Gβγ activation for the scGIRK (A) and the KACh (B) channels shown in Fig. 9. To identify the different phases of scGIRK and KACh channel activation, the F-t plots were generated as described in Materials and Methods. The horizontal lines indicate the mean F values obtained within apparently homogeneous sections of channel activity. After an initial period (∼7 min) of steady gating, the activity of both channels increased simultaneously. (C) Two representative 15-s segments of single-channel recordings are shown to illustrate the changes in the channel behavior associated with different phases of this experiment.
FIGURE 11
FIGURE 11
The slow modal transitions in scGIRK and KACh channel gating are associated with changes in the equilibrium among the four functional modes of these channels. (A) Open probability histograms generated from the initial (left panel) and late (right panel) phases of scGIRK activity shown in Fig. 9. The mean po values and the relative areas of different gamma components (shown in parentheses) are po1 = 0.00037 (65.5%), po2 = 0.0015 (28.7%), and po3 = 0.0032 (5.8%) for the initial phase; and po1 = 0.00072 (58.7%), po2 = 0.0026 (32.8%), and po3 = 0.0045 (8.5%) for the late phase of channel activation. The P values computed from these histograms are Pinitial = 0.225, and Plate = 0.270. In this experiment, the changes in the kinetic behavior of the scGIRK were associated with both a slight shift in modal equilibrium and a significant increase in the open probability of different functional modes. (B) Open probability histograms generated from the initial (left panel) and late (right panel) phases of KACh channel activity shown in Fig. 9. The mean po values and the relative areas of different components are po1 = 0.0033 (50.0%), po2 = 0.012 (37.5%), and po3 = 0.031 (12.5%) for the initial phase; and po1 = 0.0033 (20.3%), po2 = 0.015 (37.4%), and po3 = 0.053 (42.3%) for the late phase of channel activation. The P values computed from these histograms are Pinitial = 0.328 and Plate = 0.555 for the KACh channel. Thus, the changes in the gating behavior for this KACh channel were mostly associated with a shift in the modal equilibrium toward gating modes 3 and 4.
FIGURE 12
FIGURE 12
Opposing regulation of scGIRK and KACh channels. Single-channel activity recorded in the presence of 12 nM Gβ1γ7 from a membrane patch harboring a scGIRK and a KACh channel. In this experiment, an initial phase of efficient KACh channel gating and infrequent scGIRK openings was replaced with a second phase, characterized by increased scGIRK activity and infrequent KACh channel gating.
FIGURE 13
FIGURE 13
Modal distributions of scGIRK and KACh channels associated with the opposing regulation of these channels. Open probability histograms generated from the homogeneous phases of scGIRK (top panels) and KACh (bottom panels) channel gating shown in Fig. 12. For the scGIRK channel the mean po values and relative areas (given in parentheses) of different components are po1 = 0.00060 (87.2%) and po2 = 0.0030 (12.8%) for the initial phase; and po1 = 0.00061 (34.3%), po2 = 0.0026 (40.3%), and po3 = 0.0072 (25.4%) for the late phase of channel activation. For the KACh channel the mean po values and the relative areas of different components are po1 = 0.0073 (26.3%), po2 = 0.0268 (40.0%), and po3 = 0.0780 (33.7%) for the initial phase; and po1 = 0.00068 (79.4%), po2 = 0.0032 (18.7%), and po3 = 0.0080 (1.9%) for the late phase of channel activation. The P values, determined from these distributions, are Pinitial = 0.084 and Plate = 0.440 for the scGIRK channel; and Pinitial = 0.503, and Plate = 0.130 for the KACh channel. The KACh channel gating during the late phase is impaired not only by its confinement within the low-efficient modes 1 and 2, but also by the significant reduction in the open probability of individual kinetic components contributing to channel activity.

References

    1. Bettahi, I., C. L. Marker, M. I. Roman, and K. Wickman. 2002. Contribution of the Kir3.1 subunit to the muscarinic-gated atrial potassium channel IKACh. J. Biol. Chem. 277:48282–48288. - PubMed
    1. Colquhoun, D., and A. G. Hawkes. 1981. On the stochastic properties of single ion channels. Proc. R. Soc. B. 211:205–235. - PubMed
    1. Colquhoun, D., and A. G. Hawkes. 1983. The principles of the stochastic interpretation of ion-channel mechanisms. In Single Channel Recording. B. Sakmann, and E. Neher, editors. Plenum Press, New York. 135–175.
    1. Colquhoun, D., and B. Sakmann. 1985. Fast events in single-channel currents activated by acetylcholine and its analogues at the frog muscle end-plate. J. Physiol. 369:501–557. - PMC - PubMed
    1. Corey, S., and D. E. Clapham. 1998. Identification of native atrial G-protein-regulated inwardly rectifying K+ (GIRK4) channel homomultimers. J. Biol. Chem. 273:27499–27504. - PubMed

Publication types

MeSH terms

Substances

LinkOut - more resources