. 2004 Nov;52(5):1167-74.
doi: 10.1002/mrm.20255.

Computational cardiac anatomy using MRI

Affiliations

Computational cardiac anatomy using MRI

Mirza Faisal Beg et al. Magn Reson Med. 2004 Nov.

Abstract

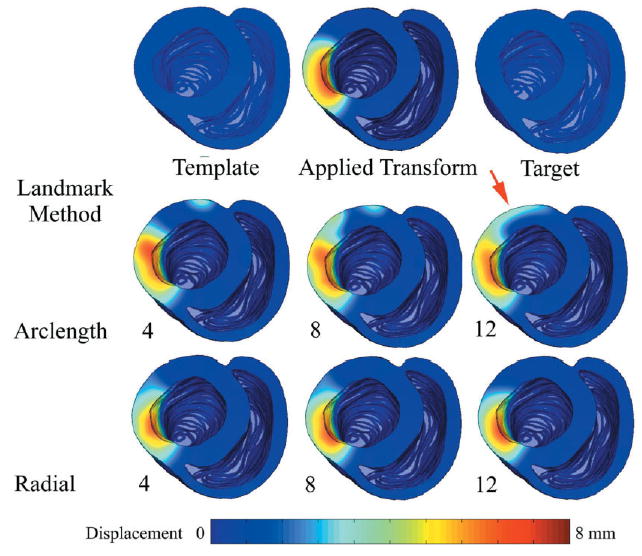
Ventricular geometry and fiber orientation may undergo global or local remodeling in cardiac disease. However, there are as yet no mathematical and computational methods for quantifying variation of geometry and fiber orientation or the nature of their remodeling in disease. Toward this goal, a landmark and image intensity-based large deformation diffeomorphic metric mapping (LDDMM) method to transform heart geometry into common coordinates for quantification of shape and form was developed. Two automated landmark placement methods for modeling tissue deformations expected in different cardiac pathologies are presented. The transformations, computed using the combined use of landmarks and image intensities, yields high-registration accuracy of heart anatomies even in the presence of significant variation of cardiac shape and form. Once heart anatomies have been registered, properties of tissue geometry and cardiac fiber orientation in corresponding regions of different hearts may be quantified.


Figures

FIG. 1
FIG. 1
a: Illustration of the mapping between the template image I0 at t = 0 to the target image I1 at t = 1. Red arrows indicate the mapping from the template to corresponding locations in the target. b: Illustration of the LDDMM transformation of a point in the template to its destination in the target.
FIG. 2
FIG. 2
Location of anatomical landmarks used to compute the LDDMM transformation. In the long axis view (a) the RV is divided into seven equally spaced planes with the valves defining their orientation. Panels b and c illustrate landmark placement according to the arc-length and radial methods, respectively.
FIG. 3
FIG. 3
Three hearts (one normal, two failing) are registered to the (normal) template heart. Each row in this figure shows the geometry of each heart from a different perspective after the application of the computed LDDMM transformation. Each of the registered hearts is colored according to the magnitude of the local displacement necessary to transform the template heart to the target heart. Blue indicates zero displacement and red indicates the maximum displacement.
FIG. 4
FIG. 4
A template heart (top left) is deformed with a known local transformation (top middle) yielding a target heart (top right). This target heart is then registered back onto the template, using each of the landmark placement methods described in the text, to determine the degree to which the simulated local deformation may be recovered. Estimated displacement maps are shown as a function of the number of left ventricular landmarks (4, 8, 12) used for each method.
FIG. 5
FIG. 5
Short axis images of the template heart are shown. The color-scale encoding represents the wall thickness of a target heart minus the wall thickness of the template heart computed at corresponding epicardial locations. a: The difference in wall thickness when comparing a normal target heart to the normal template. b: The difference when comparing a diseased target heart to the normal template. The range in wall thickness varied between −7 and 7 mm. Noticeable differences, particularly in the septum, are evident in the failing heart.
FIG. 6
FIG. 6
Mean and standard deviation of fiber inclination angle (ordinate) as a function of transmural depth (abscissa) for corresponding regions in the LV free wall, septum, and RV free wall in two registered normal hearts The locations of these regions are indicated in black on the axial images of the template and target heart. Standard deviation of fiber orientation is evaluated with local regions near each transmural point.

References

    1. Anderson KP, Walker R, Urie P, Ershler PR, Lux RL, Karwandee SV. Myocardial electrical propagation in patients with idiopathic dilated cardiomyopathy. J Clin Invest. 1993;92:122–140. - PMC - PubMed
    1. Prinzen FW, Cheriex EC, Delhaas T, van Oosterhout MF, Arts T, Wellens HJ, Reneman RS. Asymmetric thickness of the left ventricular wall resulting from asynchronous electric activation: a study in dogs with ventricular pacing and in patients with left bundle branch block. Am Heart J. 1995;130:1045–1053. - PubMed
    1. van Oosterhout MF, Prinzen FW, Arts T, Schreuder JJ, Vanagt WY, Cleutjens JP, Reneman RS. Asynchronous electrical activation induces asymmetrical hypertrophy of the left ventricular wall. Circulation. 1998;98:588–595. - PubMed
    1. van Oosterhout MF, Arts T, Muijtjens AM, Reneman RS, Prinzen FW. Remodeling by ventricular pacing in hypertrophying dog hearts. Cardiovasc Res. 2001;49:771–778. - PubMed
    1. van Oosterhout MF, Arts T, Bassingthwaighte JB, Reneman RS, Prinzen FW. Relation between local myocardial growth and blood flow during chronic ventricular pacing. Cardiovasc Res. 2002;53:831–840. - PubMed

Publication types

LinkOut - more resources