

Hypermethylation of growth arrest DNA damage-inducible gene 45 beta promoter in human hepatocellular carcinoma
- PMID: 15509538
- PMCID: PMC1618679
- DOI: 10.1016/s0002-9440(10)63425-6
Hypermethylation of growth arrest DNA damage-inducible gene 45 beta promoter in human hepatocellular carcinoma
Abstract
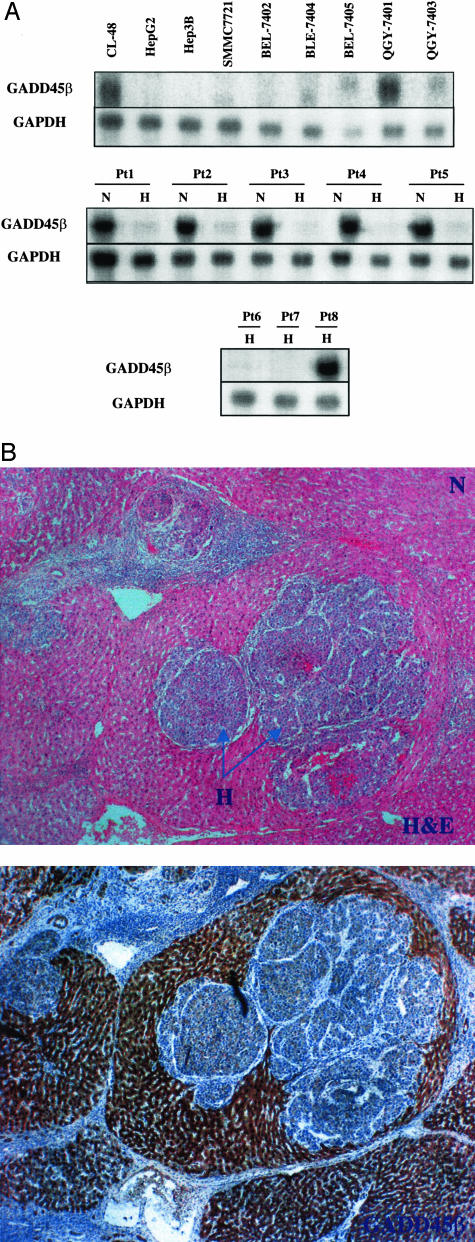
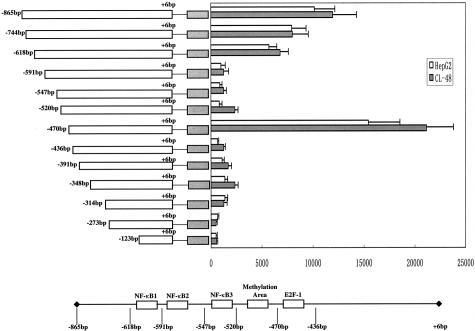
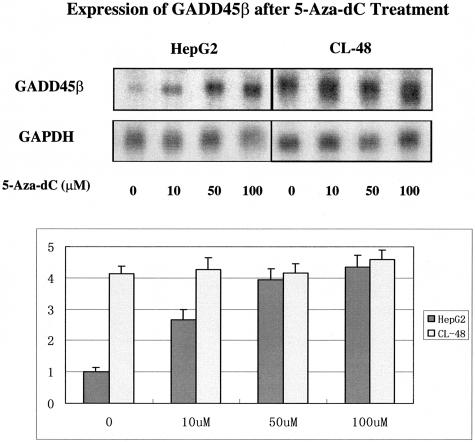
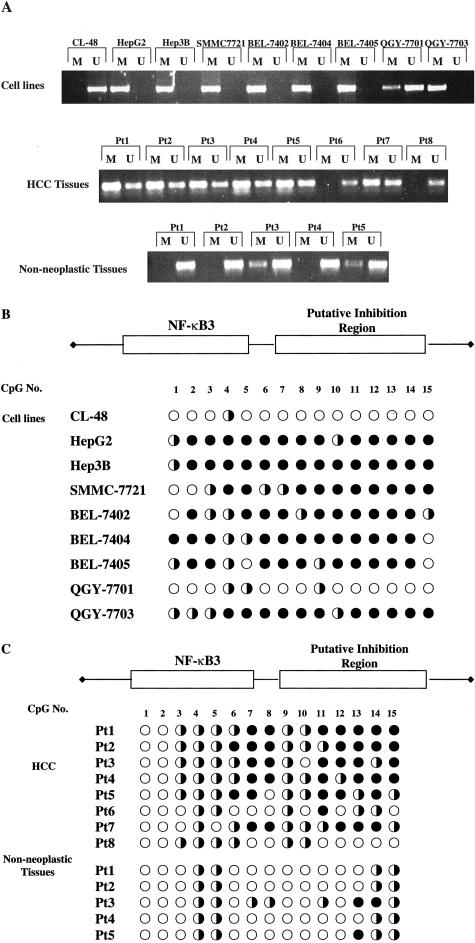
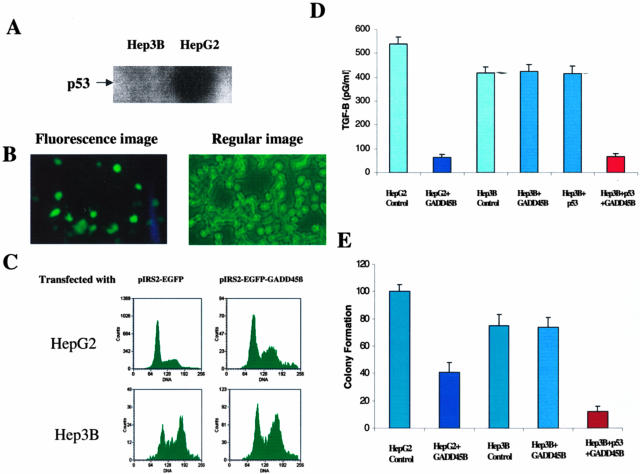
Growth arrest DNA damage-inducible gene 45 beta (GADD45beta) has been known to regulate cell growth, apoptotic cell death, and cellular response to DNA damage. Down-regulation of GADD45beta has been verified to be specific in hepatocellular cancer (HCC) and consistent with the p53 mutant, and degree of malignancy of HCC. This observation was further confirmed by eight HCC cell lines and paired human normal and HCC tumor tissues by Northern blot and immunohistochemistry. To better understand the transcription regulation, we cloned and characterized the active promoter region of GADD45beta in luciferase-expressing vector. Using the luciferase assay, three nuclear factor-kappaB binding sites, one E2F-1 binding site, and one putative inhibition region were identified in the proximal promoter of GADD45beta from -865/+6. Of interest, no marked putative binding sites could be identified in the inhibition region between -520/-470, which corresponds to CpG-rich region. The demethylating agent 5-Aza-dC was used and demonstrated restoration of the GADD45beta expression in HepG2 in a dose-dependent manner. The methylation status in the promoter was further examined in one normal liver cell, eight HCC cell lines, eight HCC tissues, and five corresponding nonneoplastic liver tissues. Methylation-specific polymerase chain reaction and sequencing of the sodium bisulfite-treated DNA from HCC cell lines and HCC samples revealed a high percentage of hypermethylation of the CpG islands. Comparatively, the five nonneoplastic correspondent liver tissues demonstrated very low levels of methylation. To further understand the functional role of GADD45beta under-expression in HCC the GADD45beta cDNA constructed plasmid was transfected into HepG2 (p53 WT) and Hep3B (p53 null) cells. The transforming growth factor-beta was assayed by enzyme-linked immunosorbent assay, which revealed a decrease to 40% in transfectant of HepG2, but no significant change in Hep3B transfectant. Whereas, Hep3B co-transfected with p53 and GADD45beta demonstrated significantly reduced transforming growth factor-beta. The colony formation was further examined and revealed a decrease in HepG2-GADD45beta transfectant and Hep3B-p53/GADD45beta co-transfectant. These findings suggested that methylation might play a crucial role in the epigenetic regulation of GADD45beta in hepatocyte transformation that may be directed by p53 status. Thus, our results provided a deeper understanding of the molecular mechanism of GADD45beta down-regulation in HCC.
Figures
Similar articles
-
Contradictory Role of Gadd45β in Liver Diseases.J Cell Mol Med. 2024 Dec;28(23):e70267. doi: 10.1111/jcmm.70267. J Cell Mol Med. 2024. PMID: 39653679 Free PMC article.
-
The induction of growth arrest DNA damage-inducible gene 45 beta in human hepatoma cell lines by S-adenosylmethionine.Am J Pathol. 2007 Jul;171(1):287-96. doi: 10.2353/ajpath.2007.070121. Am J Pathol. 2007. PMID: 17591973 Free PMC article.
-
Down-regulation of growth arrest DNA damage-inducible gene 45beta expression is associated with human hepatocellular carcinoma.Am J Pathol. 2003 Jun;162(6):1961-74. doi: 10.1016/s0002-9440(10)64329-5. Am J Pathol. 2003. PMID: 12759252 Free PMC article.
-
Frequent hypermethylation of CpG islands and loss of expression of the 14-3-3 sigma gene in human hepatocellular carcinoma.Oncogene. 2000 Nov 2;19(46):5298-302. doi: 10.1038/sj.onc.1203898. Oncogene. 2000. PMID: 11077447
-
Integrative analysis of aberrant Wnt signaling in hepatitis B virus-related hepatocellular carcinoma.World J Gastroenterol. 2015 May 28;21(20):6317-28. doi: 10.3748/wjg.v21.i20.6317. World J Gastroenterol. 2015. PMID: 26034368 Free PMC article. Review.
Cited by
-
Contradictory Role of Gadd45β in Liver Diseases.J Cell Mol Med. 2024 Dec;28(23):e70267. doi: 10.1111/jcmm.70267. J Cell Mol Med. 2024. PMID: 39653679 Free PMC article.
-
Anti-Inflammatory Action of Insulin via Induction of Gadd45-β Transcription by the mTOR Signaling Pathway.Hepat Med. 2010 Jun 1;2001(2):79-85. doi: 10.2147/HMER.S7083. Hepat Med. 2010. PMID: 21286247 Free PMC article.
-
Global reactivation of epigenetically silenced genes in prostate cancer.Cancer Prev Res (Phila). 2010 Sep;3(9):1084-92. doi: 10.1158/1940-6207.CAPR-10-0039. Epub 2010 Aug 10. Cancer Prev Res (Phila). 2010. PMID: 20699414 Free PMC article.
-
Vitamin C enhances epigenetic modifications induced by 5-azacytidine and cell cycle arrest in the hepatocellular carcinoma cell lines HLE and Huh7.Clin Epigenetics. 2016 Apr 30;8:46. doi: 10.1186/s13148-016-0213-6. eCollection 2016. Clin Epigenetics. 2016. PMID: 27134688 Free PMC article.
-
Constitutive Activation of the Human Aryl Hydrocarbon Receptor in Mice Promotes Hepatocarcinogenesis Independent of Its Coactivator Gadd45b.Toxicol Sci. 2019 Feb 1;167(2):581-592. doi: 10.1093/toxsci/kfy263. Toxicol Sci. 2019. PMID: 30346592 Free PMC article.
References
-
- Parkin DM, Pisani P, Ferlay J. Estimates of the worldwide incidence of 25 major cancers in 1990. Int J Cancer. 1999;80:827–841. - PubMed
-
- Jemal A, Murray T, Samuels A, Ghafoor A, Ward E, Thun MJ. Cancer statistics, 2003. Ca Cancer J Clin. 2003;53:5–26. - PubMed
-
- Takekawa M, Saito H. A family of stress-inducible GADD45-like proteins mediate activation of the stress-responsive MTK1/MEKK4 MAPKKK. Cell. 1998;95:521–530. - PubMed
-
- Nakayama K, Hara T, Hibi M, Hirano T, Miyajima A. A novel oncostatin M-inducible gene OIG37 forms a gene family with MyD118 and GADD45 and negatively regulates cell growth. J Biol Chem. 1999;274:24766–24772. - PubMed
-
- Zhang W, Bae I, Krishnaraju K, Azam N, Fan W, Smith K, Hoffman B, Leibermann DA. CR6: a third member in the MyD118 and GADD45 gene family which functions in negative growth control. Oncogene. 1999;18:4899–4907. - PubMed
Publication types
MeSH terms
Substances
LinkOut - more resources
Full Text Sources
Medical
Research Materials
Miscellaneous
