. 2004 Oct 27;24(43):9541-52.
doi: 10.1523/JNEUROSCI.2891-04.2004.

Dopamine modulates release from corticostriatal terminals

Affiliations

Dopamine modulates release from corticostriatal terminals

Nigel S Bamford et al. J Neurosci. .

Abstract

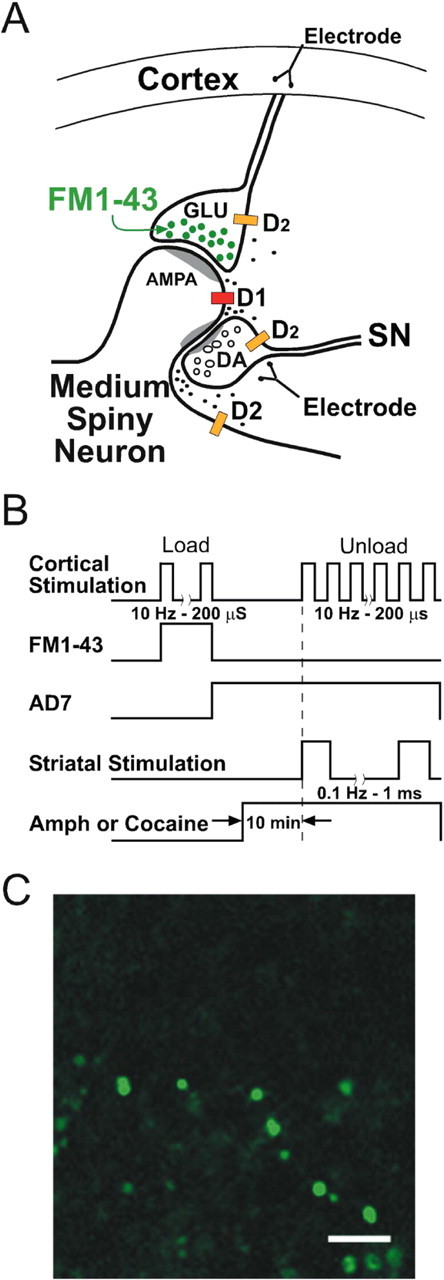
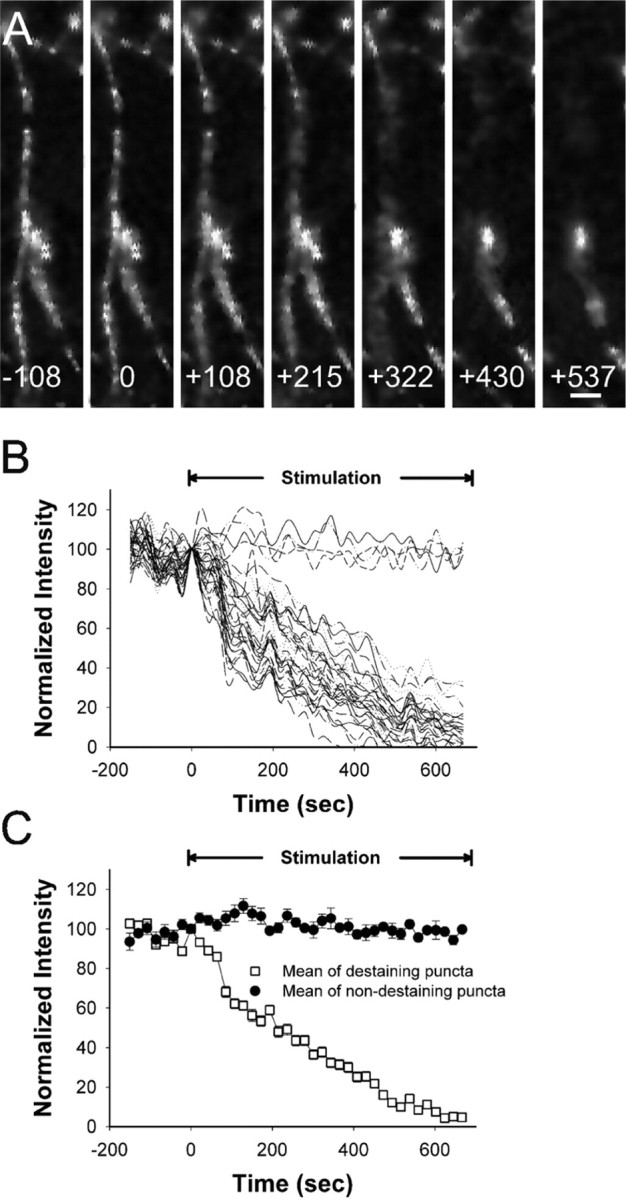
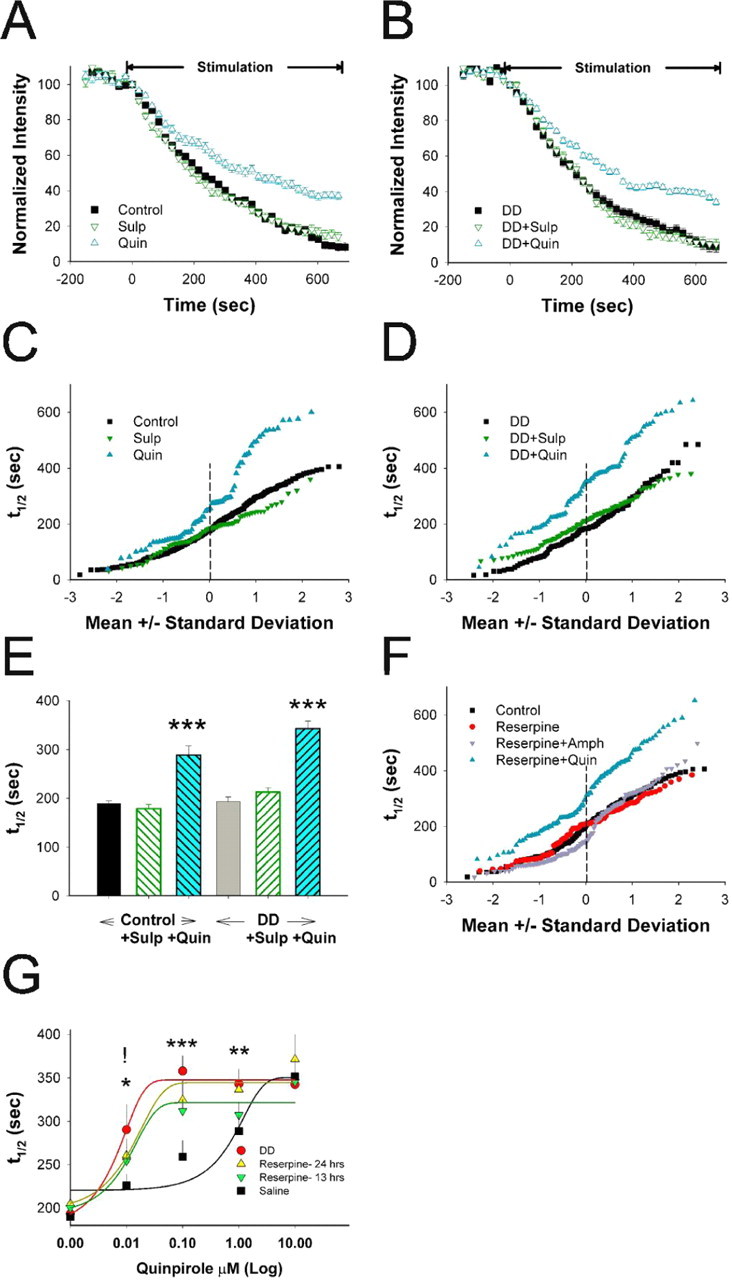
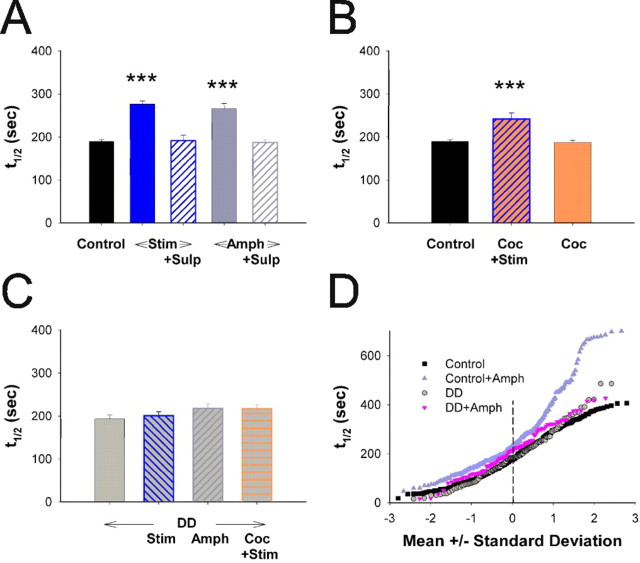
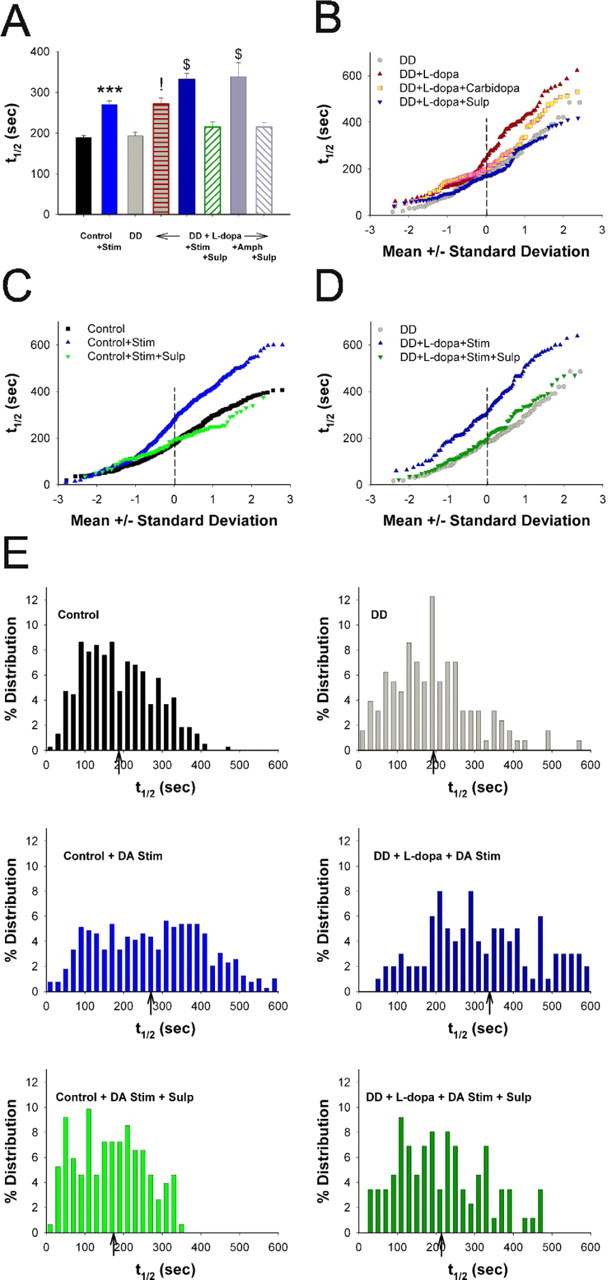
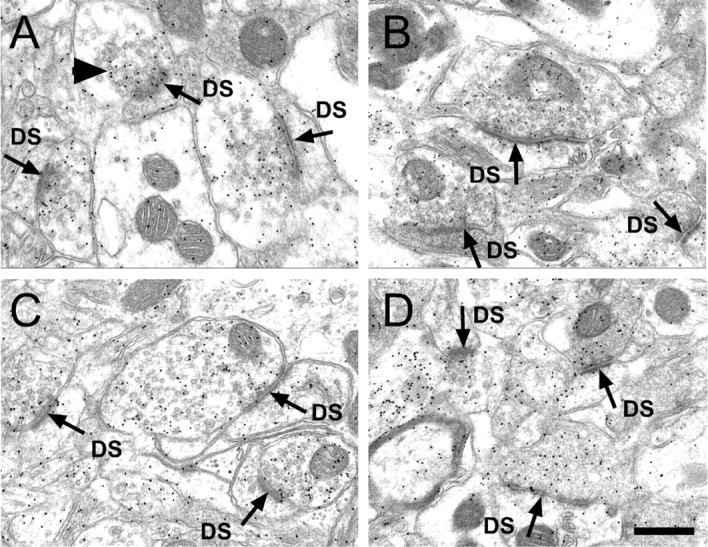
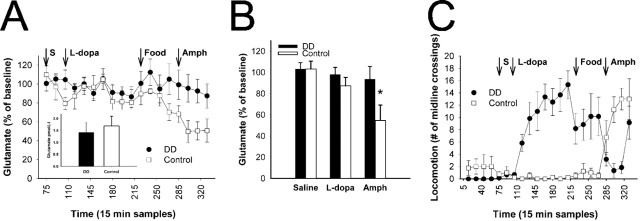
Normal striatal function is dependent on the availability of synaptic dopamine to modulate neurotransmission. Within the striatum, excitatory inputs from cortical glutamatergic neurons and modulatory inputs from midbrain dopamine neurons converge onto dendritic spines of medium spiny neurons. In addition to dopamine receptors on medium spiny neurons, D2 receptors are also present on corticostriatal terminals, where they act to dampen striatal excitation. To determine the effect of dopamine depletion on corticostriatal activity, we used the styryl dye FM1-43 in combination with multiphoton confocal microscopy in slice preparations from dopamine-deficient (DD) and reserpine-treated mice. The activity-dependent release of FM1-43 out of corticostriatal terminals allows a measure of kinetics quantified by the halftime decay of fluorescence intensity. In DD, reserpine-treated, and control mice, exposure to the D2-like receptor agonist quinpirole revealed modulation of corticostriatal kinetics with depression of FM1-43 destaining. In DD and reserpine-treated mice, quinpirole decreased destaining to a greater extent, and at a lower dose, consistent with hypersensitive corticostriatal D2 receptors. Compared with controls, slices from DD mice did not react to amphetamine or to cocaine with dopamine-releasing striatal stimulation unless the animals were pretreated with l-3,4-dihydroxyphenylalanine (l-dopa). Electron microscopy and immunogold labeling for glutamate terminals within the striatum demonstrated that the observed differences in kinetics of corticostriatal terminals in DD mice were not attributable to aberrant cytoarchitecture or glutamate density. Microdialysis revealed that basal extracellular striatal glutamate was normal in DD mice. These data indicate that dopamine deficiency results in morphologically normal corticostriatal terminals with hypersensitive D2 receptors.


Figures

Figure 1.
Figure 1.
Loading and unloading of corticostriatal terminals with FM1-43. A, The diagram depicts a simplified striatal circuit with a striatal medium spiny neuron (MSN) innervated by an excitatory glutamatergic cortical projection. The MSN is modulated by a dopaminergic projection from the ventral midbrain that stimulates presynaptic and postsynaptic dopamine D2 receptors and postsynaptic D1 receptors. Corticostriatal terminals from the forelimb primary motor cortex are loaded with FM1-43 by bipolar electrode stimulation of cortical layers V-VI. Dopamine is released by stimulating the striatum with a second bipolar electrode. DA, Dopamine; GLU, glutamate; SN, substantia nigra. B, Protocol for determining corticostriatal terminal kinetics. After FM1-43 dye loading, corticostriatal terminals were unloaded by restimulation of the forelimb motor cortex with 200 μsec (400 μA) pulses. Amphetamine, cocaine, or dopamine receptor agonists were allowed to incubate for 10 min to ensure adequate equilibrium. C, A multiphoton image of corticostriatal terminals obtained from the corresponding forelimb motor striatum, located 1.0-1.5 mm from the site of cortical stimulation, reveals similarly sized puncta arranged in en passant arrays. Scale bar, 5 μm.
Figure 2.
Figure 2.
Stimulation-dependent unloading of corticostriatal terminals. A, Multiphoton images captured every 21.5 sec reveal en passant arrays of corticostriatal terminals. Restimulation at t = 0 with 10 Hz pulses shows activity-dependent destaining of fluorescent puncta. B, Time-intensity analysis of puncta along the axon array shown in A during unloading demonstrates differential rate kinetics (n = 33). The plateau lines on the graph represent the fluorescence measurements from non-destaining puncta (n = 4). C, Mean fluorescence intensity of destaining and non-destaining puncta shown in B (mean ± SEM).
Figure 3.
Figure 3.
Effects of D2 receptor manipulation on corticostriatal terminals from DD and reserpine-treated mice. A, Decay of FM1-43 fluorescence intensity with 10 Hz cortical stimulation from control animals treated with the D2-like receptor antagonist sulpiride (Sulp; 10 μm; ▿) and the D2-like agonist quinpirole (Quin; 0.5 μm; ▵) are compared with untreated sections (▪). B, FM1-43 fluorescence in slices from DD animals exposed to Sulp and Quin show similar responses to controls. C, Normal probability curves of individual terminal halftimes shown in A. The x-axis indicates the SD from the mean value. When plotted in this manner, normally distributed data yield a straight line (Van der Kloot, 1991; Sulzer and Pothos, 2000; Bamford et al., 2004). The destaining kinetics for Quin-treated sections reveal at least two terminal subpopulations, which begin to deviate ∼0.5 SDs below the mean values. D, Normal probability plots of individual terminal halftimes in DD mice from B. Subpopulations of terminals from DD mice are less apparent than in control mice (compare C, D). E, Mean terminal destaining halftimes for experiments shown in A and B. Terminal halftimes from control slices treated with the Sulp (n = 67 puncta; 4 slices) and Quin (n = 77 puncta; 3 slices) are compared with untreated control slices (n = 381 puncta; 18 slices) and with terminal halftimes from DD slices (n = 128 puncta; 7 slices) exposed to Sulp (n = 85 puncta; 4 slices) or Quin (n = 94 puncta; 4 slices). ***p < 0.001 compared with control. F, Normal probability plots of individual terminal responses in slices from reserpine-treated mice demonstrate loss of terminal subpopulations after incubation in Quin. G, Concentration curves of corticostriatal terminal halftimes from control sections treated with Quin at 0 μm (n = 188 puncta; 10 slices), 0.01 μm (n = 80 puncta; 2 slices), 0.1 μm (n = 55 puncta; 2 slices), 1 μm (n = 77 puncta; 3 slices), and 10 μm (n = 63 puncta; 2 slices) are compared with sections from DD mice exposed to similar concentrations of Quin at 0 μm (n = 128 puncta; 7 slices), 0.01 μm (n = 24 puncta; 2 slices), 0.1 μm (n = 59 puncta; 2 slices), 1 μm (n = 94 puncta; 4 slices), and 10 μm (n = 38 puncta; 2 slices) and to sections from reserpine-treated mice killed at 13 hr [Quin at 0 μm (n = 83 puncta; 4 slices), 0.01 μm (n = 65 puncta; 4 slices), 0.1 μm (n = 93 puncta; 3 slices), 1 μm (n = 60 puncta; 3 slices), and 10 μm (n = 112 puncta; 4 slices)] and 24 hr [Quin at 0 μm (n = 70 puncta; 3 slices), 0.01 μm (n = 35 puncta; 2 slices), 0.1 μm (n = 57 puncta; 3 slices), 1 μm (n = 45 puncta; 2 slices), and 10 μm (n = 33 puncta; 3 slices)]. p < 0.01 for interaction between controls and DD or reserpine-treated mice; two-way ANOVA. *p < 0.05; **p < 0.01; ***p < 0.001 for DD mice and !p < 0.05 for reserpine-treated mice compared with similarly treated sections from control mice. The data were fit using a three-parameter sigmoidal equation (SigmaPlot).
Figure 4.
Figure 4.
Corticostriatal terminals from DD mice do not respond to stimulated release of dopamine. A, Corticostriatal terminal halftimes (t1/2) from control mice. Compared with untreated sections (Control; n = 381 puncta; 18 slices), synaptic dopamine released by bipolar striatal stimulation at 0.1 Hz (Stim; n = 391 puncta; 12 slices) or by amphetamine (Amph; n = 132 puncta; 6 slices) slowed FM1-43 dye release from corticostriatal terminals. Sulpiride (Sulp) occluded the response to striatal stimulation (n = 49 puncta; 4 slices) and to Amph (n = 95 puncta; 5 slices). ***p < 0.001 compared with control. B, Cocaine with dopamine-releasing striatal stimulation (Coc+Stim; n = 70 puncta; 5 slices) also increased corticostriatal terminal halftimes, whereas Coc without striatal stimulation did not (n = 139 puncta; 3 slices). ***p < 0.001 compared with control. C, For DD mice, corticostriatal terminal halftimes in sections with striatal stimulation (n = 108 puncta; 4 slices) or after treatment with Amph (n = 87 puncta; 6 slices) or with Coc combined with dopamine-releasing striatal stimulation (n = 119 puncta; 6 slices) show no change compared with untreated DD sections (n = 128 puncta; 7 slices). D, Normal probability plot of individual terminal halftimes for control and DD sections exposed to Amph.
Figure 5.
Figure 5.
l-Dopa restores corticostriatal responses to dopamine in DD mice. A, Corticostriatal halftimes for control mice with (Stim; n = 256 puncta; 7 slices) and without (n = 381 puncta; 18 slices) striatal stimulation are compared with DD mice (n = 128 puncta; 7 slices). DD mice treated with l-dopa (n = 107 puncta; 4 slices) demonstrate elevated halftimes of destaining, which increase further with striatal stimulation (Stim; n = 104 puncta; 4 slices) or amphetamine (Amph; n = 77 puncta; 4 slices). Sulpiride (Sulp) occludes the effect of l-dopa combined with stimulated dopamine (n = 87 puncta; 4 slices) or Amph (n = 92 puncta; 5 slices). ***p < 0.001 compared with control; !p < 0.001 compared with sections from untreated DD mice; $p < 0.01 compared with DD mice treated with l-dopa. B, Normal probability plots of individual terminal halftimes for DD mice with and without l-dopa (from A) are compared with slices from l-dopa-treated DD mice that were exposed to carbidopa (n = 110 puncta; 4 slices) and Sulp (n = 114 puncta; 4 slices). C, Normal probability plots of individual terminal halftimes (A) for control mice demonstrate that stimulated dopamine shifts ∼85% of the slower destaining terminals to a lower rate of destaining. Sulp occludes the effect of released dopamine. D, Normal probability plots of terminal halftimes from DD slices are compared with dopamine-stimulated (Stim) sections from l-dopa-treated DD mice with and without Sulp. E, Histograms show distributions of corticostriatal destaining times from control and DD slices shown in C and D. After cortical stimulation, the mean terminal destaining times for control and DD terminals is ∼200 sec (top). Both populations shift to longer destaining times (∼300 sec) when dopamine is released via striatal stimulation (middle). The effect of dopamine is attenuated by Sulp (bottom). Arrows indicate mean values that shift to the right (slower destaining) with dopamine release and normalize after incubation with Sulp.
Figure 6.
Figure 6.
Electron photomicrographs using the immunogold technique to localize an antibody against the neurotransmitter glutamate within the dorsolateral striatum. A, Control adult. Three nerve terminals are seen making an asymmetrical synaptic contact (arrows) with an underlying dendritic spine (DS). Within the nerve terminal are numerous 10 nm gold particles (arrowhead), indicating the location of the antibody. These gold particles are found overlying round synaptic vesicles. Note the large number of gold particles located within the nerve terminal compared with the underlying dendritic spine. B, DD adult. Note that the density of nerve terminal glutamate immunolabeling appears similar to that seen in the control adult group in A. C, Control P15. The overall morphology and the density of nerve terminal immunogold labeling appear similar to that found in the adult control and adult DD groups. D, DD P15. Although these mice were never exposed to l-dopa, the overall morphology and density of nerve terminal glutamate immunolabeling are similar to all the groups represented in A-C. Scale bar, 0.50 μm. No significant differences were found between groups.
Figure 7.
Figure 7.
Microdialysis in DD and control mice. A, Saline (S) and l-dopa (50 mg/kg) treatment do not alter extracellular glutamate concentration in either genotype. In contrast, amphetamine (Amph; 5 mg/kg, i.p.) decreased the extracellular concentration of glutamate in control mice (n = 4) but not in DD mice (n = 6). Arrows denote systemic drug treatment. Inset, Basal extracellular level of striatal glutamate within the dialysate sample as expressed in picomoles per microliter for each genotype. B, Pooled data from A quantifying the response to drug treatment. *p < 0.05. C, Locomotor behavior during microdialysis. Each data point reflects that average number of midline crossings during a 60 sec interval (collected every 15 min).

Similar articles

Cited by

References

    1. Akopian G, Walsh JP (2002) Corticostriatal paired-pulse potentiation produced by voltage-dependent activation of NMDA receptors and L-type Ca(2+) channels. J Neurophysiol 87: 157-165. - PubMed
    1. Albin RL, Young AB, Penney JB (1989) The functional anatomy of basal ganglia disorders. Trends Neurosci 12: 366-375. - PubMed
    1. Arbuthnott GW, Ingham CA, Wickens JR (1998) Modulation by dopamine of rat corticostriatal input. Adv Pharmacol 42: 733-736. - PubMed
    1. Arnt J (1985) Behavioural stimulation is induced by separate dopamine D-1 and D-2 receptor sites in reserpine-pretreated but not in normal rats. Eur J Pharmacol 113: 79-88. - PubMed
    1. Bamford NS, Zhang H, Schmitz Y, Wu NP, Cepeda C, Levine MS, Schmauss C, Zakharenko SS, Zablow L, Sulzer D (2004) Heterosynaptic dopamine neurotransmission selects sets of corticostriatal terminals. Neuron 42: 653-663. - PubMed

Publication types

MeSH terms

LinkOut - more resources