. 2004 Oct 27;24(43):9572-9.
doi: 10.1523/JNEUROSCI.2854-04.2004.

Monitoring neural activity and [Ca2+] with genetically encoded Ca2+ indicators

Affiliations

Monitoring neural activity and [Ca2+] with genetically encoded Ca2+ indicators

Thomas A Pologruto et al. J Neurosci. .

Abstract

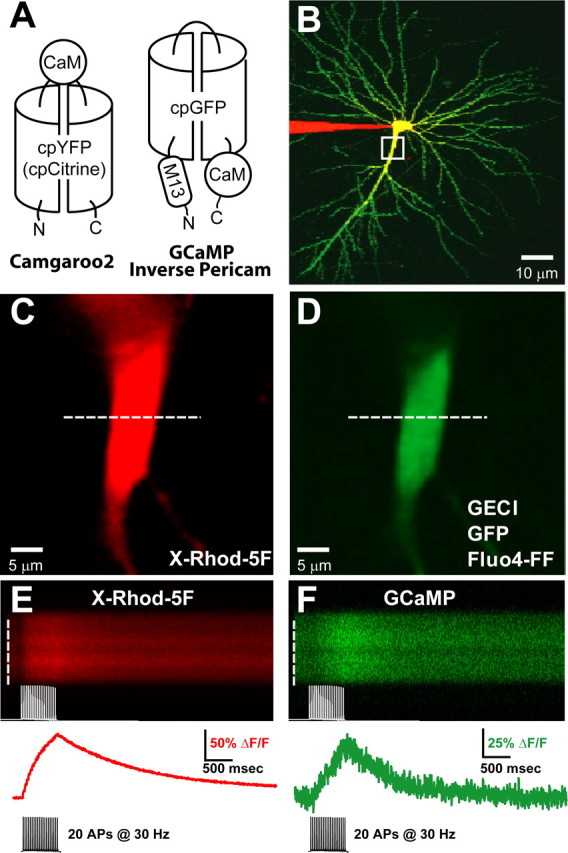
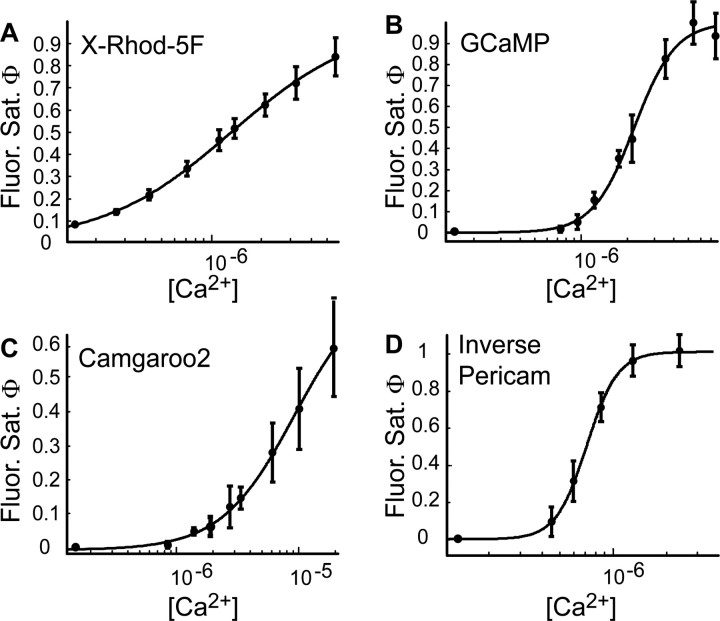
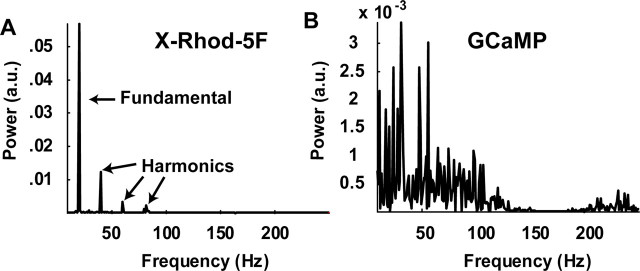
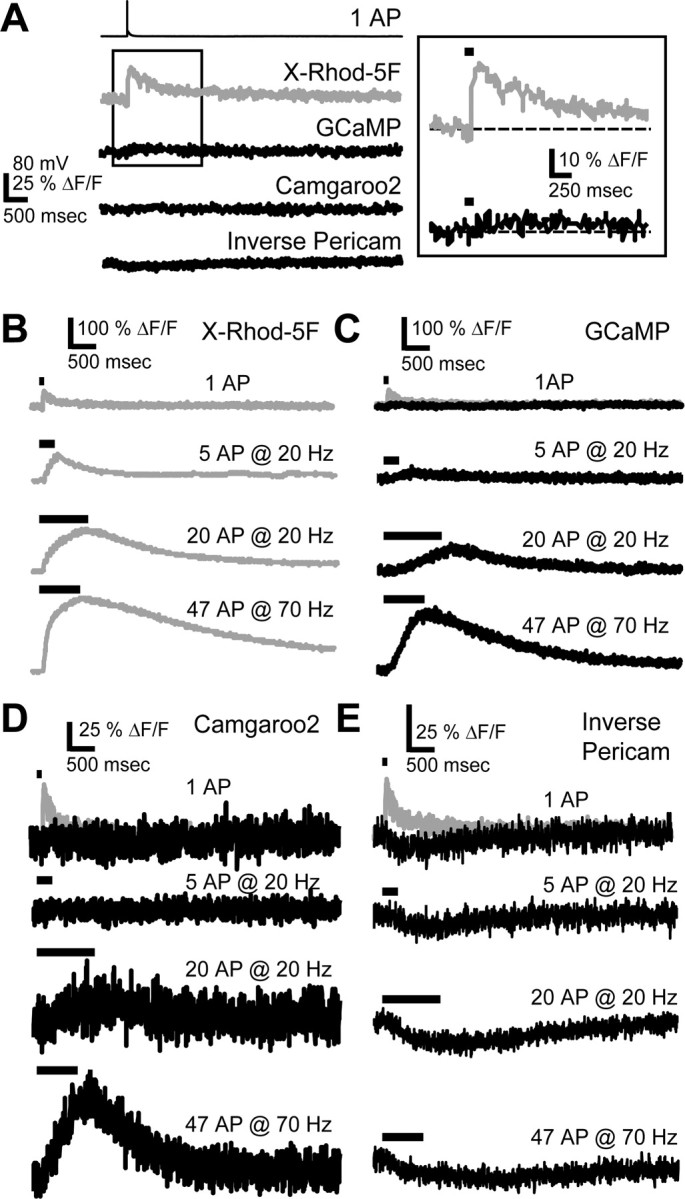
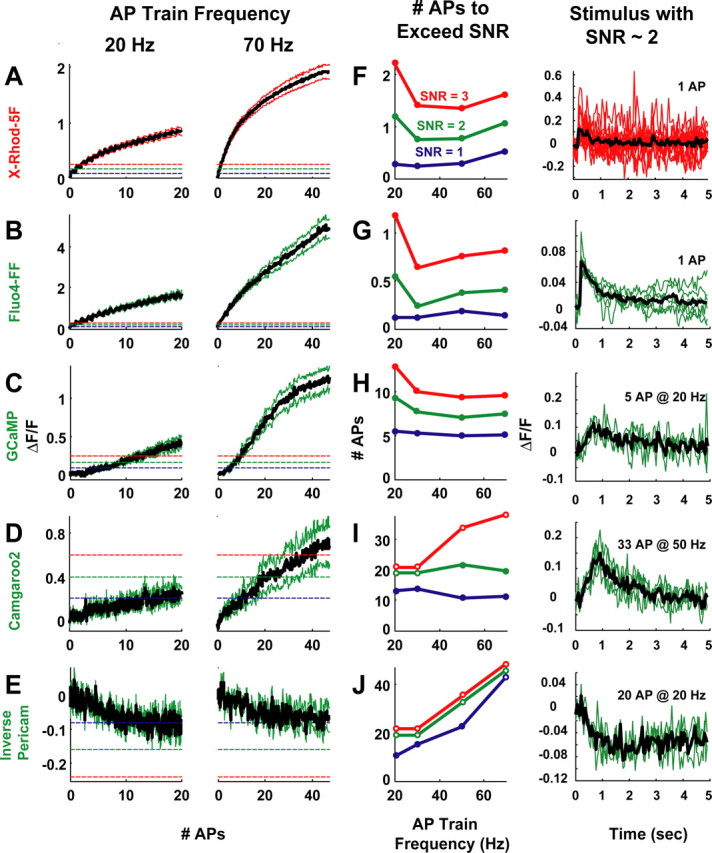
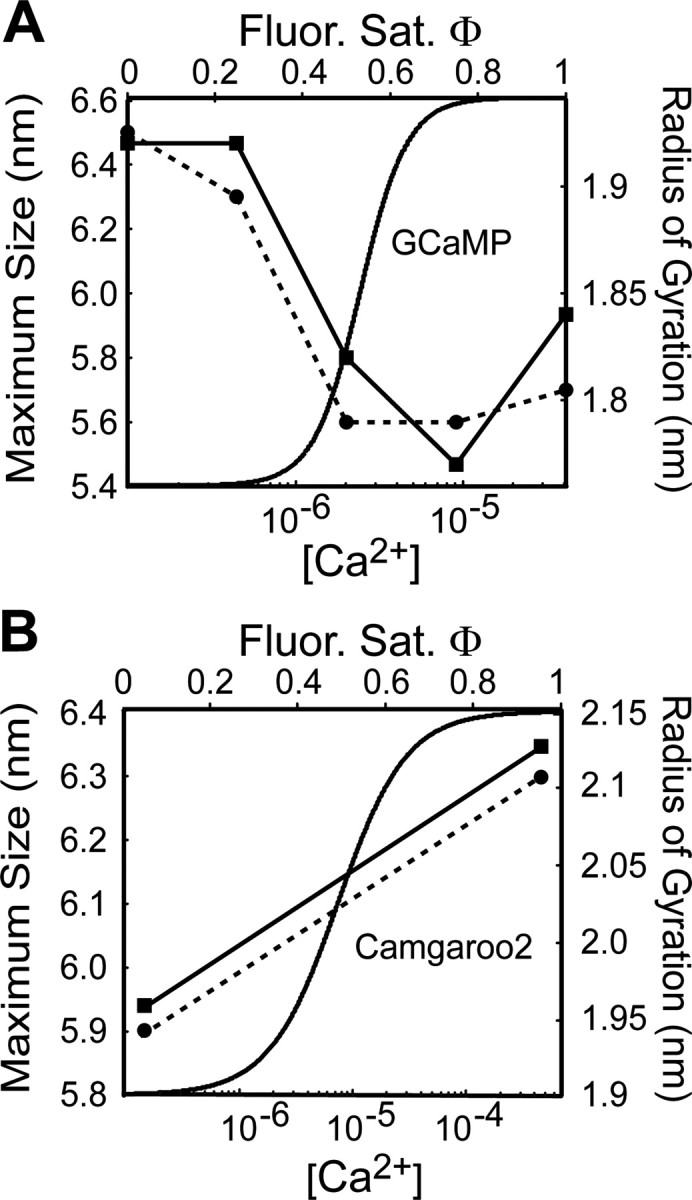
Genetically encoded Ca2+ indicators (GECIs) based on fluorescent proteins (XFPs) and Ca2+-binding proteins [like calmodulin (CaM)] have great potential for the study of subcellular Ca2+ signaling and for monitoring activity in populations of neurons. However, interpreting GECI fluorescence in terms of neural activity and cytoplasmic-free Ca2+ concentration ([Ca2+]) is complicated by the nonlinear interactions between Ca2+ binding and GECI fluorescence. We have characterized GECIs in pyramidal neurons in cultured hippocampal brain slices, focusing on indicators based on circularly permuted XFPs [GCaMP (Nakai et al., 2001), Camgaroo2 (Griesbeck et al., 2001), and Inverse Pericam (Nagai et al., 2001)]. Measurements of fluorescence changes evoked by trains of action potentials revealed that GECIs have little sensitivity at low action potential frequencies compared with synthetic [Ca2+] indicators with similar affinities for Ca2+. The sensitivity of GECIs improved for high-frequency trains of action potentials, indicating that GECIs are supralinear indicators of neural activity. Simultaneous measurement of GECI fluorescence and [Ca2+] revealed supralinear relationships. We compared GECI fluorescence saturation with CaM Ca2+-dependent structural transitions. Our data suggest that GCaMP and Camgaroo2 report CaM structural transitions in the presence and absence of CaM-binding peptide, respectively.


Figures

Figure 1.
Figure 1.
Dual-color imaging of AP-evoked fluorescence responses in CA1 pyramidal cells transfected with GECIs. A, Molecular topology of GECIs used in this study. Binding Ca2+ causes changes in GECI fluorescence. Camgaroo2 (left) is based on the cpYFP (yellow fluorescent protein) molecule cpCitrine and has CaM inserted between the two halves of the cpCitrine barrel. GCaMP and Inverse Pericam (right) are based on cpGFP and contain CaM inserted C terminal to the cpGFP barrel and the CaM-binding peptide M13 inserted N terminal. B, CA1 pyramidal neuron expressing GCaMP (green; 9 d after transfection) and patched with a pipette filled with 500 μm X-Rhod-5F (red). The yellow region indicates overlapping green and red fluorescence. C, D, Magnified image of primary apical dendrite (boxed region in B; location of line scan, dashed white line), showing red X-Rhod-5F (C) and green GECI (D) fluorescence. E, F, Red and green fluorescence transients evoked by a train of 20 APs at 30 Hz. Fluorescence was averaged across the spatial extent of the dendrite (white dashed lines; top) to produce the fluorescence response (red and green traces; bottom) used for subsequent analysis.
Figure 5.
Figure 5.
Comparison of genetically encoded and synthetic Ca2+ indicator fluorescence saturation. Fluorescence saturation curves (Φ vs [Ca2+]; mean ± SEM) were fit (solid lines) to a general Hill model (Eq. 1). A, X-Rhod-5F fluorescence saturation measured simultaneously with [Ca2+] (using Fluo4-FF). The data show excellent agreement with the expected values for a synthetic Ca2+ indicator (Table 1). B-D, GECI fluorescence saturation measured simultaneously with [Ca2+] using X-Rhod-5F (Table 1).
Figure 4.
Figure 4.
Frequency response of genetically encoded and synthetic Ca2+ indicator fluorescence. Power spectra of fluorescence time series (from Fig. 3A-E) were calculated, and the spectra of X-Rhod-5F (A) and GCaMP (B) from a 20 Hz AP train are shown. A, X-Rhod-5F fluorescence power spectrum showing pronounced peaks at the AP train frequency (fundamental; 20 Hz) and its harmonics. B, GCaMP fluorescence power spectrum does not reveal a definite peak, even at the AP train frequency (20 Hz).
Figure 6.
Figure 6.
FRAP reveals that GECIs have mobilities similar to GFP. A, A region of the apical dendrite from a cell transfected with GFP used for FRAP measurement. B, A magnified image of the FRAPed spine (boxed region in A), with the region used for line scan FRAP indicated by a black line. C, Fluorescence across marked region in B showing bleaching (50 msec bleach time) and recovery in raw fluorescence traces. D, Normalized fluorescence across marked region in B before and after photobleaching. The recovery time constant is measured by fitting the fluorescence recovery to a single exponential. E, Cumulative probability distribution of recovery lifetimes (circles) for individual spines from cells expressing GFP, GCaMP, Camgaroo2, and Inverse Pericam. A Kolmogorov-Smirnov pairwise comparison revealed the distributions to be identical (p > 0.3). F, Mean recovery times were identical (ANOVA; p > 0.3) for all GECIs and were similar to GFP. Box plots (black lines) show mean value (central line) as well as 95% confidence intervals (black trapezoids above and below mean line).
Figure 2.
Figure 2.
Fluorescence responses to APs. A, Single AP-evoked fluorescence transients averaged over 13 trials. The scale bar applies to all traces. Right, Expanded view (boxed region from left) of X-Rhod-5F and GCaMP responses to one AP (line above trace indicates stimulus duration). B-E, Responses to trains of APs for X-Rhod-5F (B), GCaMP (C), Camgaroo2 (D), and Inverse Pericam (E). A scaled copy of the X-Rhod-5F single AP fluorescence response has been overlayed on the single AP response in C-E (gray trace). Each trace is the average of four to eight trials from the same cell.
Figure 3.
Figure 3.
SNRs of fluorescence responses to APs. Data with additional AP trains (frequencies: 20, 30, 50, and 70 Hz) are in supplemental material (available at www.jneurosci.org). A-E, Fluorescence responses to trains of APs delivered at 20 and 70 Hz [black trace is the mean response, colored traces indicate the SEM, and dashed horizontal lines depict different SNRs; 1, blue; 2, green; 3, red]. The SNR is the ratio of ΔF/F to the SD, σ, of ΔF/F from the background fluorescence. The red (A; X-Rhod-5F; N = 8 cells) and green (B; Fluo4-FF; N = 8 cells) synthetic Ca2+ indicators respond to all stimuli, including single APs. GCaMP (C; N = 13 cells), Camgaroo2 (D; N = 6 cells), and Inverse Pericam (E; N = 9 cells) respond poorly (sublinear) to low-frequency AP trains and are supralinear for stronger stimuli. F-J, Left, Activity (AP number and frequency) necessary to elicit a given SNR (closed circles; same colors for SNRs as in A-E). If the indicator never reached a certain SNR, the value was set to the maximum number of APs delivered (open circles). The maximum number of APs delivered was as follows: 20 APs for 20 and 30 Hz, 33 APs for 50 Hz, and 47 APs for 70 Hz. Single APs can yield SNR ∼2 for synthetic Ca2+ indicators (F, G). GCaMP (H), Camgaroo2 (I), and Inverse Pericam (J) require stronger stimuli to obtain the same SNR as synthetic indicators. F-J, Right, Individual trials from single cells (colored lines; mean response in black; smoothed with a 50 msec averaging filter) for a stimulus with SNR ∼2.
Figure 7.
Figure 7.
GECI fluorescence changes are coupled to CaM structural transitions. A, Structural transitions of CaM associated with M13 peptide derived from x-ray scattering studies. The abrupt change in fluorescence saturation is coupled to the structural collapse [i.e., decrease in both the maximum size (solid line) and radius of gyration (dashed line); see Discussion for details] of the M13-CaM complex after Ca2+ loading. GCaMP fluorescence is plotted for comparison. Structural data (filled circles and squares) is from the study by Krueger et al. (1998). B, Structural transitions of free-CaM. The occupation of Ca2+-binding sites adds stability to the CaM structure, causing reorientation of the N- and C-terminal domains and increases α-helical content of central helix (Sun et al., 1999). This will cause an elongation of the free-CaM molecule after Ca2+ loading (increase in both the maximum size and radius of gyration; see Discussion for details). Camgaroo2 fluorescence is plotted for comparison. Structural data (filled circles and squares) is from study by Krueger et al. (1998). The solid line (maximum size) and dashed line (radius of gyration) are linear interpolations between the points reflecting the stepwise elongation of free-CaM after Ca2+ loading.

References

    1. Baird GS, Zacharias DA, Tsien RY (1999) Circular permutation and receptor insertion within green fluorescent proteins. Proc Natl Acad Sci USA 96: 11241-11246. - PMC - PubMed
    1. Berridge MJ (1998) Neuronal calcium signaling. Neuron 21: 13-26. - PubMed
    1. Callaway JC, Ross WN (1995) Frequency-dependent propagation of sodium action potentials in dendrites of hippocampal CA1 pyramidal neurons. J Neurophysiol 74: 1395-1403. - PubMed
    1. Demaurex N, Frieden M (2003) Measurements of the free luminal ER Ca(2+) concentration with targeted “cameleon” fluorescent proteins. Cell Calcium 34: 109-119. - PubMed
    1. Evenas J, Malmendal A, Thulin E, Carlstrom G, Forsen S (1998) Ca2+ binding and conformational changes in a calmodulin domain. Biochemistry 37: 13744-13754. - PubMed

Publication types

LinkOut - more resources