. 2004 Oct 27;24(43):9612-22.
doi: 10.1523/JNEUROSCI.5583-03.2004.

Calcium release from presynaptic ryanodine-sensitive stores is required for long-term depression at hippocampal CA3-CA3 pyramidal neuron synapses

Affiliations

Calcium release from presynaptic ryanodine-sensitive stores is required for long-term depression at hippocampal CA3-CA3 pyramidal neuron synapses

Vivek K Unni et al. J Neurosci. .

Abstract

Although Ca2+ release from internal stores has been proposed to be important for the induction of long-term synaptic plasticity, the importance of Ca2+ stores localized in presynaptic terminals remains unclear. Here, we have selectively applied pharmacological antagonists to either the presynaptic or postsynaptic cell in paired whole-cell recordings from hippocampal CA3 pyramidal neurons in slice culture. We demonstrate directly the necessary role of presynaptic, but not postsynaptic, ryanodine-sensitive Ca2+ stores in the induction of NMDA receptor (NMDAR)-dependent long-term depression (LTD). Using two-photon laser scanning microscopy, we further find that release from the ryanodine-sensitive stores during prolonged synaptic stimulation generates a slowly rising Ca2+ signal in the presynaptic terminal that is required for the induction of LTD. Moreover, this form of LTD has a significant presynaptic component of expression because it causes a marked decrease in the rate of release from CA3 neuron presynaptic terminals of FM 1-43, a fluorescent probe of synaptic vesicle cycling. Thus, Ca2+ release from presynaptic ryanodine-sensitive stores is critical in the induction of a presynaptic component of NMDAR-dependent LTD.


Figures

Figure 4.
Figure 4.
Presynaptic terminal Ca2+ rises in two distinct phases during the LTD induction protocol. A, Image of a CA3 pyramidal neuron filled with Oregon Green 488 BAPTA-1. The white box delineates the approximate region shown at higher magnification in B. Scale bar (in C), 50 μm. B, Basal dendritic region showing thin, smooth axons and thicker, spiny dendrites. The arrows point to an example of one axon crossing from top right to bottom left of field. Scale bar (in C), 10 μm. C, High-magnification view of presynaptic terminal (arrow). Scale bar, 1 μm. D, Single images taken from the terminal shown in C, before (1), during the beginning (2), during the end (3), and after (4) the LTD induction protocol. Fluorescence changes coded with a thermal look-up table, small changes coded by “cooler” colors, and larger changes coded by “warmer” colors are shown. Scale bar (in C), 1 μm. E, Ca2+ rise measured as ΔF/F (change in fluorescence intensity divided by initial baseline fluorescence intensity) in the terminal shown in C during the LTD induction protocol. The striped bar marks delivery of LTD induction protocol (5 Hz stimulation for 3 min). The numbers along the trace show times at which images in D were obtained. F, Inset, Presynaptic Ca2+ signal during induction of LTD detected in a cell loaded with 300 μm Fluo-5F, a relatively low-affinity Ca2+ dye. A similar fast and slow component to the Ca2+ signal is detected. Data were averaged from seven cells.
Figure 1.
Figure 1.
CA3-CA3 synapses exhibit NMDAR-dependent LTD. A, Left, Peak EPSCs recorded from a synaptically connected pair of CA3-CA3 pyramidal neurons before and after induction of LTD (induction protocol shown by striped bar). Letters a and b mark time periods during the recording from which sample traces are shown (on the right). Right, Presynaptic and postsynaptic responses before (a) and after (b) induction of LTD. The bottom traces are current-clamp records showing an overlay of 10 consecutive APs elicited in the presynaptic cell by current injection. The top traces are voltage-clamp records (Vm = -70 mV) from the postsynaptic cell showing an overlay of 10 consecutive EPSCs. Calibration: vertical, 40 mV, 100 pA; horizontal, 20 msec. B, Averaged (normalized) peak EPSC during experiment before and after LTD induction (n = 11 pairs). C, Sliding boxcar average (window size, 20 points) of data in the presence (top trace) and absence (bottom trace) of 50 μm d-APV. D, LTD at CA3-CA3 synapses does not require activation of mGluR5 receptors. Averaged (normalized) peak EPSCs before and after induction of LTD (induction stimulation shown by bar) in the presence (open squares; n = 6) and absence (closed circles; n = 6) of 10 μm MPEP. In this experiment, extracellular field stimulation was used to elicit EPSCs and induce LTD. No sliding boxcar was used.
Figure 3.
Figure 3.
Pharmacological analysis of effects of calcium channel antagonists, glutamate receptor antagonists, and disruption of calcium stores on induction of LTD. A, B, Results from boxcar averaged paired recordings showing effects of selective voltage-gated calcium channel antagonist. A, Bath applied nitrendipine (5 μm) does not prevent the induction of LTD (n = 3 pairs). B, Bath applied Ni2+ (50 μm) prevents the induction of LTD (n = 6 pairs). C, Summary of pharmacology experiments. Each bar plots mean reduction in EPSC after induction of LTD. Error bars indicate SEM. Control, Normal extent of LTD in the absence of pharmacological agents; RR, LTD with postsynaptic ruthenium red (400 μm; n = 3); RyPost, LTD with postsynaptic ryanodine (300 μm; n = 4); AIDA, LTD with bath-applied AIDA (200 μm; n = 3); Nitren, LTD with bath-applied nitrendipine (5 μm; n = 3); Ni, LTD with bath-applied Ni2+ (50 μm; n = 6); APV, LTD with bath-applied d-APV (50 μm; n = 5); RyPre, LTD with presynaptic ryanodine (300 μm; n = 4); CPA, LTD with presynaptic CPA (30 μm; n = 4); Thap, LTD with presynaptic thapsigargin (2-5 μm; n = 5). The asterisk indicates that an agent caused a significant inhibition in the amount of LTD (ANOVA, p < 0.002; with post hoc Bonferroni test, p < 0.05).
Figure 2.
Figure 2.
LTD requires presynaptic, but not postsynaptic, ryanodine-sensitive Ca2+ stores. A, Average (normalized) peak EPSC elicited by extracellular stimulation before and after LTD induction in normal external solution (filled circles; n = 8 cells), in presence of external CPA (2-3 μm; open inverted triangles; n = 10 cells), or in presence of external ryanodine (10 μm; filled squares; n = 8 cells). B, Bath application of ryanodine (10 μm; n = 4 cells) 5 min after the end of the LTD induction protocol does not inhibit LTD. C-F, Results from boxcar averaged paired recordings showing effects of selective presynaptic or postsynaptic application of antagonists through recording electrodes. C, Presynaptic application of CPA (30 μm; n = 4 pairs). D, Presynaptic application of thapsigargin (2-5 μm; n = 5 pairs). E, Presynaptic application of ryanodine (300 μm; n = 4 pairs). F, Postsynaptic application of ryanodine (300 μm; n = 4 pairs).
Figure 5.
Figure 5.
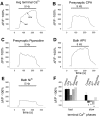
Slow phase of Ca2+ signal depends on release from presynaptic ryanodine-sensitive stores, and the fast phase depends partially on influx via T-type or R-type VGCCs. A, Average presynaptic terminal Ca2+ rise during LTD induction protocol (n = 11). Arrows point to fast and slow phases. Selective presynaptic application of CPA (30 μm; n = 15; B) or ryanodine (300 μm; n = 5; C) selectively inhibits the slow phase. D, Bath application of d-APV (50 μm) does not affect either the fast or slow phase (n = 3). E, Bath application of Ni2+ (50 μm) prevents the slow phase and partially inhibits the fast phase (n = 4). F, Summary data from all terminal imaging experiments. The asterisk indicates condition that is significantly different from control (post hoc Fisher LSD test; p < 0.05).
Figure 6.
Figure 6.
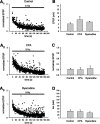
Inhibition of ryanodine-sensitive Ca2+ stores does not reduce postsynaptic depolarization during LTD induction. A1-A3, Average (normalized) peak EPSP during LTD induction protocol (striped bar): A1, control conditions; A2, in the presence of external CPA (2-3 μm); A3, in the presence of external ryanodine (10 μm). B, Size of initial EPSP (average of first 4 responses) during LTD protocol under the three conditions shown in A (ANOVA; p > 0.40). C, Normalized size of steady-state EPSP size at the end of the train (average of last 50 responses) during LTD protocol (ANOVA; p > 0.90). D, Time constant of decay (tau) of EPSP size during LTD induction protocol (ANOVA; p > 0.83).
Figure 7.
Figure 7.
Activity-dependent destaining of FM 1-43 from presynaptic CA3 terminals. Images show FM 1-43 staining for one field of fluorescent puncta that had been previously loaded with dye. Time stamps are marked with reference to the beginning of the 1.5 Hz destaining stimulation, beginning at time 0″ and continuing for 4′ 20″. Scale bar, 10 μm.
Figure 8.
Figure 8.
LTD expression involves a decrease in presynaptic FM 1-43 release that depends on ryanodine-sensitive stores. A1, Decay of average fluorescence intensity of puncta during unloading of FM 1-43 with 1.5 Hz stimulation before (filled circles) and after (open circles) the 5 Hz LTD induction protocol (n = 7 slices). The black bar represents duration of 1.5 Hz unloading stimulation. A2, Frequency histogram of unloading halftimes (t1/2) for individual puncta before the LTD protocol. The filled circle on top shows the mean (and SEM) of the distribution (n = 165 puncta). A3, Frequency histogram of halftimes after the LTD induction protocol (significantly different from distribution before 5 Hz stimulation; Kolmogorov-Smirnov 2-sample test; p < 0.001). The open circle shows the mean of the distribution (n = 168 puncta). The filled circle shows the mean of the distribution from A2. B1, Unloading of FM 1-43 when the LTD protocol was given in the presence of d-APV (50 μm; n = 4 slices). B2, Unloading halftime and the mean of the distribution (filled circle) before the LTD induction protocol (n = 280 puncta). B3, Unloading time and the mean of the distribution (open circle) after the LTD induction protocol (Kolmogorov-Smirnovtest; p > 0.05; n = 150 puncta). The filled circle shows the mean of the distribution from B2. Note that the open and filled circles overlap. C1, Unloading of FM 1-43 when the LTD protocol was given in the presence of ryanodine (10 μm; n = 4 slices). C2, Halftime (t1/2) of unloading and the mean of the distribution (filled circle) before the LTD protocol (n = 374 puncta). C3, Halftime and the mean of the distribution (open circle) after the LTD protocol (Kolmogorov-Smirnov test; p > 0.05; n = 297 puncta). The filled circle shows the mean of the distribution from C2.

Similar articles

Cited by

References

    1. Arancio O, Kiebler M, Lee CJ, Lev-Ram V, Tsien RY, Kandel ER, Hawkins RD (1996) Nitric oxide acts directly in the presynaptic neuron to produce long-term potentiation in cultured hippocampal neurons. Cell 87: 1025-1035. - PubMed
    1. Ascher-Landsberg J, Saunders T, Elovitz M, Phillippe M (1999) The effects of 2-aminoethoxydiphenyl borate, a novel inositol 1,4,5-trisphosphate receptor modulator on myometrial contractions. Biochem Biophys Res Commun 264: 979-982. - PubMed
    1. Ashby MC, Petersen OH, Tepikin AV (2003) Spatial characterisation of ryanodine-induced calcium release in mouse pancreatic acinar cells. Biochem J 369: 441-445. - PMC - PubMed
    1. Babcock DF, Hille B (1998) Mitochondrial oversight of cellular Ca2+ signaling. Curr Opin Neurobiol 8: 398-404. - PubMed
    1. Berridge MJ (1998) Neuronal calcium signaling. Neuron 21: 13-26. - PubMed

Publication types

MeSH terms

LinkOut - more resources