. 2004 Nov;24(22):9986-99.
doi: 10.1128/MCB.24.22.9986-9999.2004.

Mechanism of B-cell receptor-induced phosphorylation and activation of phospholipase C-gamma2

Affiliations

Mechanism of B-cell receptor-induced phosphorylation and activation of phospholipase C-gamma2

Yeun Ju Kim et al. Mol Cell Biol. 2004 Nov.

Abstract

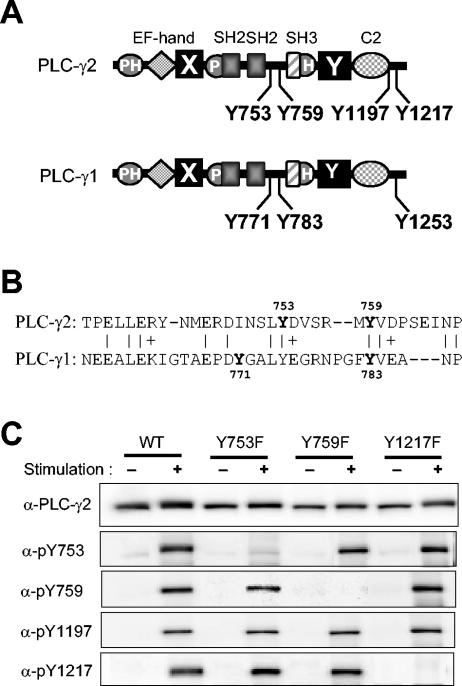
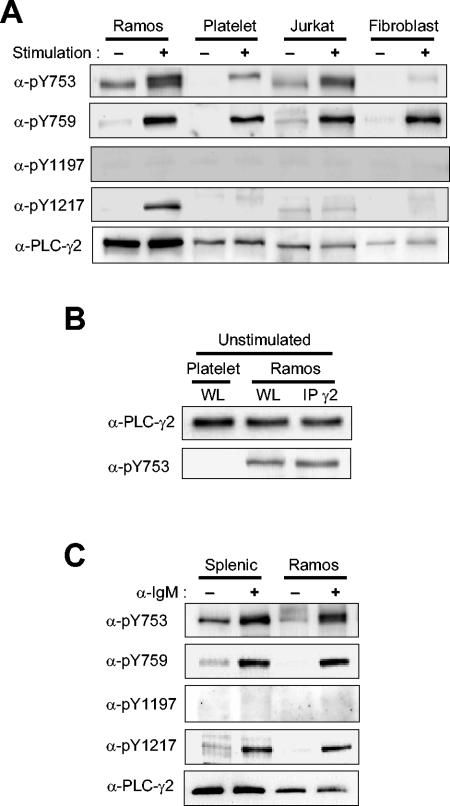
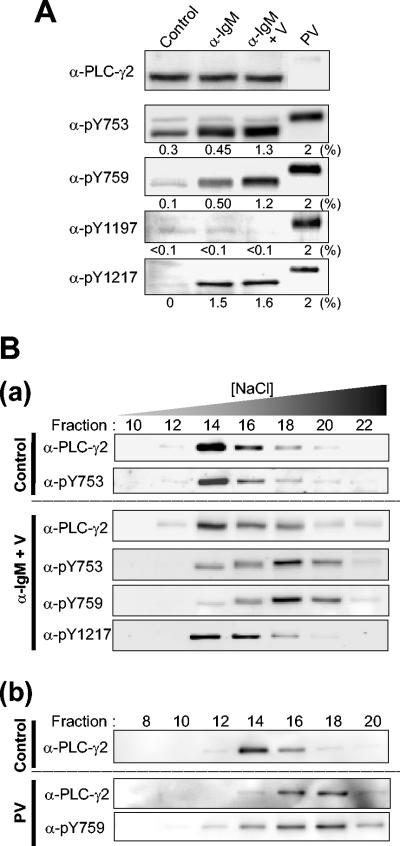
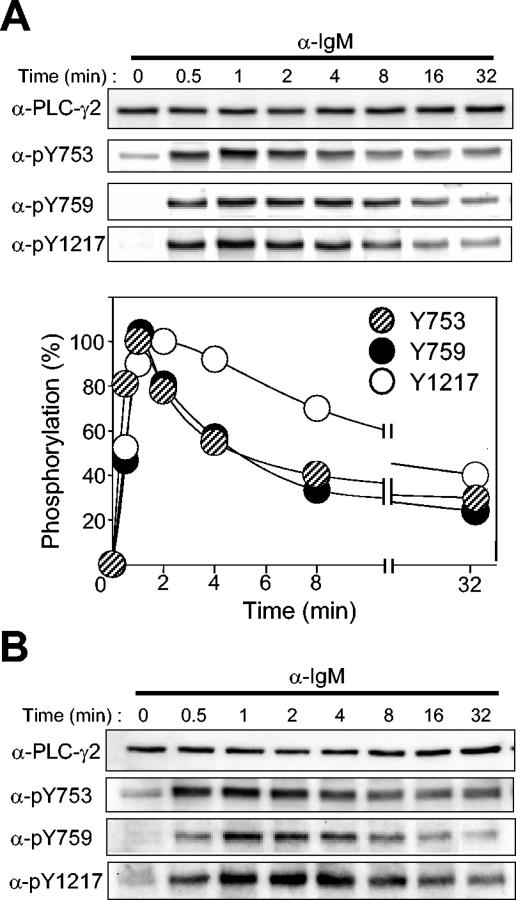
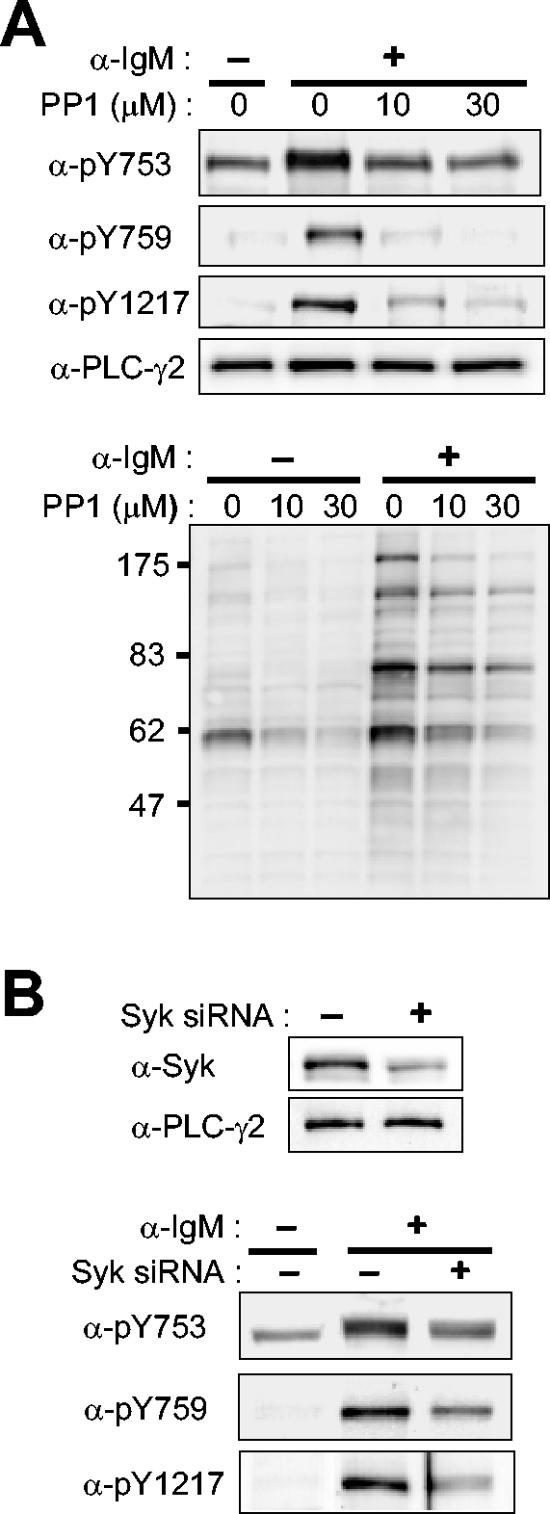
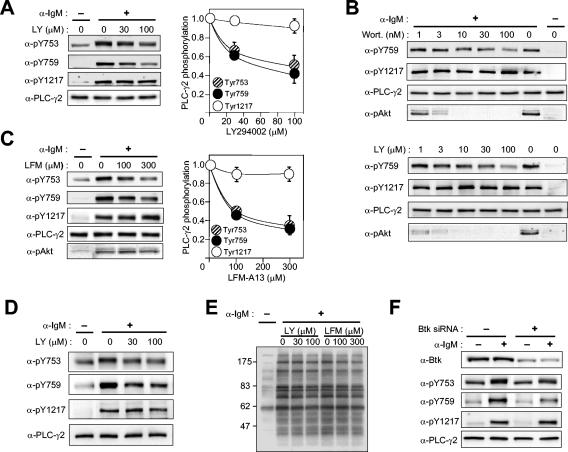
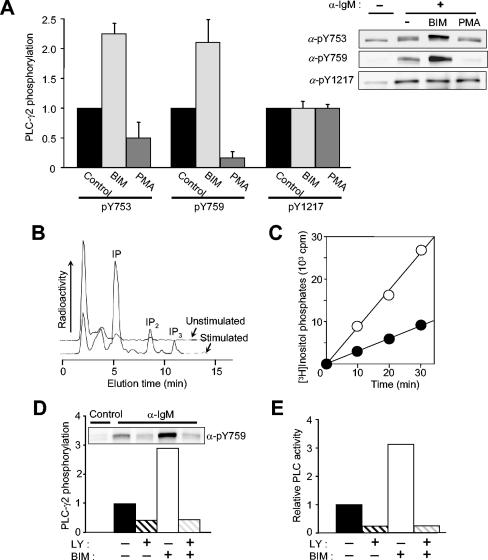
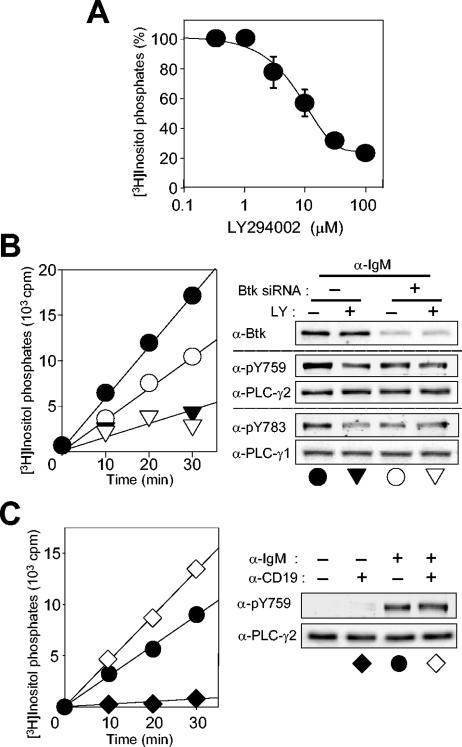
Phospholipase C-gamma2 (PLC-gamma2) plays an important role in B-cell signaling. Phosphorylation of various tyrosine residues of PLC-gamma2 has been implicated in regulation of its lipase activity. With the use of antibodies specific for each of the putative phosphorylation sites, we have now shown that PLC-gamma2 is phosphorylated on Y753, Y759, and Y1217 in response to engagement of the B-cell receptor in Ramos cells, as well as in murine splenic B cells. In cells stimulated maximally via this receptor, the extent of phosphorylation of Y1217 was three times that of Y753 or of Y759. Stimulation of Jurkat T cells or platelets via their immunoreceptors also elicited phosphorylation of Y753 and Y759 but not that of Y1217. A basal level of phosphorylation of Y753 was apparent in unstimulated lymphocytes. The extent of phosphorylation of Y753 and Y759, but not that of Y1217, correlated with the lipase activity of PLC-gamma2. Examination of the effects of various pharmacological inhibitors and of RNA interference in Ramos cells suggested that Btk is largely, but not completely, responsible for phosphorylation of Y753 and Y759, whereas phosphorylation of Y1217 is independent of Btk. Finally, phosphorylation of Y1217 and that of Y753 and Y759 occurred on different PLC-gamma2 molecules.


Figures

FIG. 1.
FIG. 1.
Characterization of antibodies specific for PLC-γ2 phosphorylated at each of four Tyr residues. (A) Domain organization and tyrosine phosphorylation sites of PLC-γ1 and PLC-γ2. The two isozymes share a domain organization that includes an NH2-terminal PH domain, an EF-hand domain, catalytic X and Y domains, a split PH domain (indicated by P and H), two SH2 domains, an SH3 domain, and a C2 domain. (B) Alignment of the amino acid sequences of human PLC-γ1 and PLC-γ2 between the SH2 and SH3 domains. Identical or similar residues are indicated by | and +, respectively. Tyrosine residues in bold are sites of phosphorylation. (C) Specificity of antibodies to phosphorylated forms of PLC-γ2. Null TV-1 cells were infected with recombinant vaccinia viruses encoding either wild-type (WT) PLC-γ2 or Tyr→Phe mutants (Y753F, Y759F, and Y1217F) thereof. They were then deprived of serum overnight and either left unstimulated or stimulated for 10 min with PDGF (0.1 μg/ml) in the presence of 2 mM H2O2 and 1 mM sodium vanadate. Cell lysates were subjected to immunoblot analysis with antibodies to PLC-γ2 or with antibodies specific for PLC-γ2 phosphorylated on Y753, Y759, Y1197, or Y1217, as indicated (α).
FIG. 2.
FIG. 2.
Phosphorylation of PLC-γ2 in various cell types. (A) Ramos cells, platelets, Jurkat cells, and human PLC-γ2-expressing Null TV-1 cells were stimulated (or not) with anti-IgM (25 μg/ml) for 1 min, with convulxin (100 μg/ml) for 2 min, with OKT-3 (0.3 μg/ml) for 1 min, or with PDGF (0.1 μg/ml) for 10 min, respectively. Cell lysates were then subjected to immunoblot analysis with the indicated antibodies (α-). The amounts of protein applied to the gel were adjusted so that the lysates from the different cells yielded similar intensities on the blot with anti-pY759. (B) Lysates of unstimulated platelets and Ramos cells (WL) and proteins immunoprecipitated (IP) with anti-PLC-γ2 from the lysate of Ramos cells (IP γ2) were subjected to immunoblot analysis with anti-PLC-γ2 and anti-pY753. The amounts of protein loaded onto the gel were adjusted to give similar blot intensities with anti-PLC-γ2. (C) Ramos cells and mouse splenic B cells were stimulated with anti-IgM (25 μg/ml) for 1 min. Cell lysates were then subjected to immunoblot analysis with indicated antibodies. The amounts of protein applied to the gel were adjusted as in panel A.
FIG. 3.
FIG. 3.
PLC-γ2 phosphorylation in Ramos cells stimulated by BCR engagement. (A) Ramos cells were left unstimulated (control) or were stimulated either for 1 min with anti-IgM (25 μg/ml) in the absence (α-IgM) or presence (α-IgM + V) of 5 mM sodium vanadate or for 10 min with pervanadate (PV; derived from 5 mM sodium vanadate and 2 mM H2O2). Cell lysates were then subjected to immunoblot analysis with the indicated antibodies (α-). The amount of lysate protein applied to the gel for the pervanadate-treated cells was 2% of that applied in the other lanes. Numbers under each panel represent the percentage of PLC-γ2 molecules phosphorylated on the corresponding residue calculated on the basis of the assumption that PLC-γ2 molecules were fully phosphorylated in the pervanadate-treated cells; they are means of values from three independent experiments. (B) Ramos cells were either left unstimulated (Control) or stimulated for 1 min with anti-IgM (25 μg/ml) in the presence of 5 mM sodium vanadate (α-IgM + V) (a). In a separate experiment, they were either left unstimulated (Control) or stimulated with pervanadate (PV; 5 mM sodium vanadate and 2 mM H2O2) for 10 min (b). Lysate proteins were subjected to fractionation by HPLC on a heparin-5PW column with a linear NaCl gradient. The resulting fractions were subjected to immunoblot analysis with the indicated antibodies.
FIG. 4.
FIG. 4.
Time courses of BCR-induced PLC-γ2 phosphorylation. (A) Ramos cells were stimulated with anti-IgM (25 μg/ml) for the indicated times, after which cell lysates were subjected to immunoblot analysis with the indicated antibodies (α-) (upper panel). The intensities of the PLC-γ2 bands were quantified and plotted against time (lower panel); data are means of four independent determinations and are expressed as a percentage of the maximal value for each site after subtraction of the corresponding basal level of phosphorylation. (B) Mouse splenic B cells were stimulated with anti-IgM (25 μg/ml) for the indicated times, after which cell lysates were subjected to immunoblot analysis with the indicated antibodies.
FIG. 5.
FIG. 5.
Effects of inhibition of Src family kinases or of Syk depletion on BCR-induced PLC-γ2 phosphorylation in Ramos cells. (A) Effects of Src family inhibition. Ramos cells were treated for 10 min with the indicated concentrations of PP1 or vehicle before stimulation for 1 min with anti-IgM (25 μg/ml). Cell lysates were then subjected to immunoblot analysis with the indicated antibodies (α-) to PLC-γ2 (upper 4 panels) or with antiphosphotyrosine (lower panel). The positions of molecular size standards are shown in kilodaltons in the bottom panel. (B) Effects of Syk depletion. Ramos cells were transfected (or not) twice with an interval of 2 days with Syk siRNA. Four days after the initial transfection, they were subjected to immunoblot analysis with anti-Syk or anti-PLC-γ2 (upper panel); alternatively, they were stimulated (or not) for 1 min with anti-IgM (25 μg/ml) before immunoblot analysis with the indicated antibodies (lower panel).
FIG. 6.
FIG. 6.
Effects of inhibition or depletion of Btk on BCR-induced PLC-γ2 phosphorylation in Ramos cells. (A) Effect of LY294002 (LY) on PLC-γ2 phosphorylation. Ramos cells were treated for 10 min with vehicle or the indicated concentrations of LY294002 before stimulation (or not) for 1 min with anti-IgM (25 μg/ml). Cell lysates were then subjected to immunoblot analysis with the indicated antibodies (α-) (left panels). The immunoblot intensities were corrected for the basal level of phosphorylation, normalized by the corrected value for stimulated cells pretreated with vehicle, and plotted against inhibitor concentration (right panels); data are means ± standard error of values from four independent experiments. (B) Effects of wortmannin (Wort.) and LY294002 on PLC-γ2 phosphorylation and Akt phosphorylation on Thr308. Ramos cells were treated for 10 min with the indicated concentrations of inhibitors before stimulation (or not) for 1 min with anti-IgM (25 μg/ml). Cell lysates were then subjected to immunoblot analysis with the indicated antibodies. (C) Effect of LFM-A13 on PLC-γ2 and Akt phosphorylation. Ramos cells were treated for 10 min with vehicle or the indicated concentrations of LFM-A13 before stimulation (or not) for 1 min with anti-IgM (25 μg/ml). Cell lysates were then subjected to immunoblot analysis with the indicated antibodies. (D) Effect of LY 294002 on PLC-γ2 phosphorylation in splenic B cells. Murine B cells were treated with indicated concentrations of the inhibitor for 10 min before stimulation for 1 min with anti-IgM (25 μg/ml). Cell lysates were then subjected to immunoblot analysis with the indicated antibodies. (E) Effects of LY294002 and LFM-A13 on overall tyrosine phosphorylation of cellular proteins. Lysates of Ramos cells similar to those in panels A and C were subjected to immunoblot analysis with antiphosphotyrosine. The positions of molecular size standards are shown in kilodaltons. (F) Effects of Btk depletion on PLC-γ2 phosphorylation. Ramos cells were transfected with a control RNA or Btk siRNA. Three days after transfection, the cells were left unstimulated or stimulated for 1 min with anti-IgM (25 μg/ml). Cell lysates were subjected to immunoblot analysis with the indicated antibodies.
FIG. 7.
FIG. 7.
Effects of changes in PKC activity on the phosphorylation and activation of PLC-γ2 in Ramos cells. (A) Effects of BIM and PMA on PLC-γ2 phosphorylation. Ramos cells were incubated for 10 min in the absence or presence of 2.5 μM BIM or 1 μM PMA before stimulation (or not) for 1 min with anti-IgM (25 μg/ml). Cell lysates were then subjected to immunoblot analysis with the indicated antibodies (α-) (right panel). The relative blot intensities for stimulated cells (after correction for basal values) were determined as means ± standard error from three independent experiments (left panel). (B) Detection of [3H]inositol phosphates produced in unstimulated and BCR-stimulated cells. Ramos cells that had been metabolically labeled with myo-[3H]inositol were left unstimulated or were stimulated for 30 min with anti-IgM (25 μg/ml) in the presence of 20 mM LiCl. [3H]inositol phosphates in cell extracts were analyzed with an HPLC system equipped with an on-line radioactivity detector. (C) Time course of phosphoinositide hydrolysis. Cells labeled with myo-[3H]inositol were treated for 10 min with LiCl in the absence (closed circles) or presence (open circles) of 2.5 μM BIM and then stimulated for the indicated times with anti-IgM (25 μ/ml). [3H]inositol phosphates (IP + IP2 + IP3) in cell extracts were then measured as in panel B. (D and E) LY294002 sensitivity of the effect of BIM on BCR-induced PLC-γ2 phosphorylation (D) and on PLC activity (E). Ramos cells were treated for 10 min in the absence or presence of 2.5 μM BIM, 100 μM LY294002, or 2.5 μM BIM plus 100 μM LY294002 before stimulation for 1 min with anti-IgM (25 μ/ml). Cell lysates were subjected to immunoblot analysis with anti-pY759 (inset). The relative blot intensities were determined as means from three independent experiments. In panel E, cells labeled with myo-[3H]inositol were treated with BIM or LY294002 and then stimulated with anti-IgM as in panel D in the presence of 20 mM LiCl for 30 min. The amounts of [3H]inositol phosphates in cell extracts were then measured. Data are expressed as relative PLC activity after subtraction of basal values.
FIG. 8.
FIG. 8.
Role of PI 3-kinase in BCR-induced PLC-γ2 activation in Ramos cells. (A) Concentration dependence of PLC inhibition by LY294002. Cells labeled with myo-[3H]inositol were treated for 10 min with the indicated concentrations of LY294002 in the presence of 20 mM LiCl and then stimulated for 30 min with anti-IgM (25 μg/ml). [3H]inositol phosphates in cell extracts were then measured. Data are means ± standard error of three independent determinations. (B) Effects of Btk RNAi and PI 3-kinase inhibition on BCR-induced PLC activity and phosphorylation of PLC-γ2 and PLC-γ1. Ramos cells were transfected with a control RNA (closed symbols) or Btk siRNA (open symbols). After 3 days, the cells were labeled with myo-[3H]inositol, treated for 10 min with 100 μM LY294002 (triangles) or vehicle (circles) in the presence of LiCl, and then stimulated for the indicated times with anti-IgM (25 μg/ml). [3H]inositol phosphates in cell extracts were then measured (left panel); data are representative of one of three independent determinations. Alternatively, the siRNA-transfected cells were treated with 100 μM LY294002 for 10 min before stimulation with anti-IgM (25 μg/ml) for 1 min; cell lysates were then subjected to immunoblot analysis with the indicated antibodies (α-) (right panel). (C) Effect of CD19 costimulation on BCR-induced PLC activity and PLC-γ2 phosphorylation. Cells labeled with myo-[3H]inositol were stimulated in the presence of LiCl for the indicated times with anti-IgM (25 μ/ml) (circles), anti-CD19 (10 μg/ml) (closed diamonds), or anti-IgM (25 μg/ml) plus anti-CD19 (10 μg/ml) (open diamonds), after which [3H]inositol phosphates in cell extracts were measured (left panel); data are from a representative experiment out of three independent determinations. Alternatively, cells stimulated for 1 min were subjected to immunoblot analysis with the indicated antibodies.

References

    1. Brazil, D. P., and B. A. Hemmings. 2001. Ten years of protein kinase B signalling: a hard Akt to follow. Trends Biochem. Sci. 26:657-664. - PubMed
    1. Brdicka, T., M. Imrich, P. Angelisova, N. Brdickova, O. Horvath, J. Spicka, I. Hilgert, P. Luskova, P. Draber, P. Novak, N. Engels, J. Wienands, L. Simeoni, J. Osterreicher, E. Aguado, M. Malissen, B. Schraven, and V. Horejsi. 2002. Non-T cell activation linker (NTAL): a transmembrane adaptor protein involved in immunoreceptor signaling. J. Exp. Med. 196:1617-1626. - PMC - PubMed
    1. Buhl, A. M., and J. C. Cambier. 1999. Phosphorylation of CD19 Y484 and Y515, and linked activation of phosphatidylinositol 3-kinase, are required for B cell antigen receptor-mediated activation of Bruton's tyrosine kinase. J. Immunol. 162:4438-4446. - PubMed
    1. Carpenter, G., and Q. Ji. 1999. Phospholipase C-γ as a signal-transducing element. Exp. Cell Res. 253:15-24. - PubMed
    1. Carter, R. H., D. A. Tuveson, D. J. Park, S. G. Rhee, and D. T. Fearon. 1991. The CD19 complex of B lymphocytes. Activation of phospholipase C by a protein tyrosine kinase-dependent pathway that can be enhanced by the membrane IgM complex. J. Immunol. 147:3663-3671. - PubMed

Publication types

MeSH terms