

Measuring global trends in the status of biodiversity: red list indices for birds
- PMID: 15510230
- PMCID: PMC524254
- DOI: 10.1371/journal.pbio.0020383
Measuring global trends in the status of biodiversity: red list indices for birds
Abstract
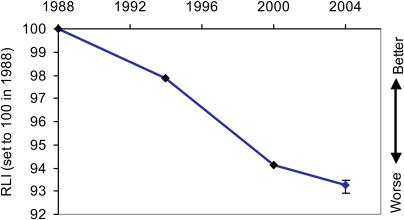
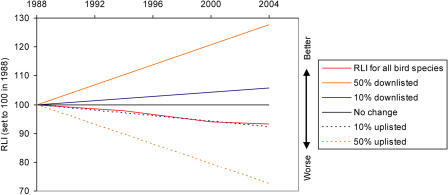
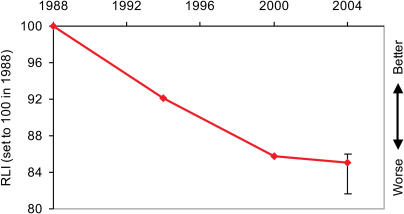
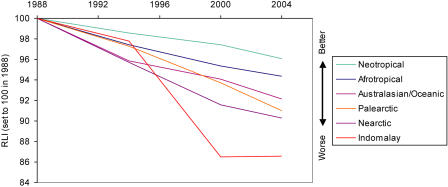
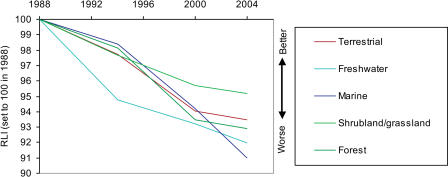
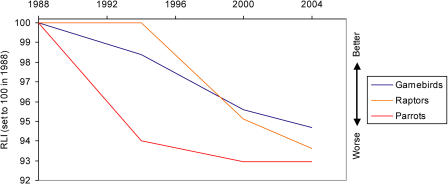
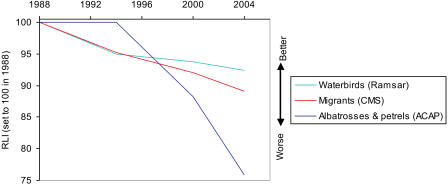
The rapid destruction of the planet's biodiversity has prompted the nations of the world to set a target of achieving a significant reduction in the rate of loss of biodiversity by 2010. However, we do not yet have an adequate way of monitoring progress towards achieving this target. Here we present a method for producing indices based on the IUCN Red List to chart the overall threat status (projected relative extinction risk) of all the world's bird species from 1988 to 2004. Red List Indices (RLIs) are based on the number of species in each Red List category, and on the number changing categories between assessments as a result of genuine improvement or deterioration in status. The RLI for all bird species shows that their overall threat status has continued to deteriorate since 1988. Disaggregated indices show that deteriorations have occurred worldwide and in all major ecosystems, but with particularly steep declines in the indices for Indo-Malayan birds (driven by intensifying deforestation of the Sundaic lowlands) and for albatrosses and petrels (driven by incidental mortality in commercial longline fisheries). RLIs complement indicators based on species population trends and habitat extent for quantifying global trends in the status of biodiversity. Their main weaknesses are that the resolution of status changes is fairly coarse and that delays may occur before some status changes are detected. Their greatest strength is that they are based on information from nearly all species in a taxonomic group worldwide, rather than a potentially biased subset. At present, suitable data are only available for birds, but indices for other taxonomic groups are in development, as is a sampled index based on a stratified sample from all major taxonomic groups.
Conflict of interest statement
The authors have declared that no conflicts of interest exist.
Figures
References
-
- Balmford A, Green RE, Jenkins M. Measuring the changing state of nature. Trends Ecol Evol. 2003;18:326–330.
-
- BirdLife International. Cambridge and Barcelona: BirdLife International and Lynx Edicions; 2000. Threatened birds of the world; 852 pp.
-
- BirdLife International. Cambridge: BirdLife International; 2001. Threatened birds of Asia: The BirdLife International Red Data Book; 3,038 pp.
-
- BirdLife International. Globally threatened bird forums. Available: http://208.185.149.227/WebX?13@106.EvPVayPZb4F.2@.1de4282b via the Internet. 2004a Accessed 20 April 2004.
-
- BirdLife International. Cambridge: BirdLife International; 2004b. State of the world's birds 2004: Indicators for our changing planet; 73 pp.
Publication types
MeSH terms
LinkOut - more resources
Full Text Sources
Research Materials
