. 2004 Oct 28:5:168.
doi: 10.1186/1471-2105-5-168.

d-matrix - database exploration, visualization and analysis

Affiliations

d-matrix - database exploration, visualization and analysis

Dominik Seelow et al. BMC Bioinformatics. .

Abstract

Background: Motivated by a biomedical database set up by our group, we aimed to develop a generic database front-end with embedded knowledge discovery and analysis features. A major focus was the human-oriented representation of the data and the enabling of a closed circle of data query, exploration, visualization and analysis.

Results: We introduce a non-task-specific database front-end with a new visualization strategy and built-in analysis features, so called d-matrix. d-matrix is web-based and compatible with a broad range of database management systems. The graphical outcome consists of boxes whose colors show the quality of the underlying information and, as the name suggests, they are arranged in matrices. The granularity of the data display allows consequent drill-down. Furthermore, d-matrix offers context-sensitive categorization, hierarchical sorting and statistical analysis.

Conclusions: d-matrix enables data mining, with a high level of interactivity between humans and computer as a primary factor. We believe that the presented strategy can be very effective in general and especially useful for the integration of distinct data types such as phenotypical and molecular data.


Figures

Figure 1
Figure 1
Relational database schema of the CardioVascular Genetics database (CVGdb) Tables are represented as boxes and foreign keys constraints as arrows. Grey boxes mark the schema subset interfaced in d-matrix. SV – Sequence Variations; RV_versus_LV, A_versus_V, RVH_in_RV, VSD_in_RA and TOF_in_RV are tables containing gene expression results [4].
Figure 2
Figure 2
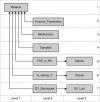
Data Model Shown is an excerpt of the three-level tree for interfacing d-matrix with CVGdb. The table "Patients" defines the root of the tree. Each branch refers to a defined data group consisting of one or two tables, respectively.
Figure 3
Figure 3
Data selection and query Within the data selection schema (A) users can choose all nodes they want to be included in the query. If a data group consists of two tables, the nodes are represented by vertical arrows for the first table and diagonal arrows for the second. The attribute on which the query display is focused can be selected by the three-banded icons, which switch from black-white to color and vice versa upon selection. Furthermore, trees can be saved and reloaded for subsequent analysis. Upon selection all nodes are listed in a secondary form (B), where query conditions, display and sorting order as well as the implementation of descriptive and advanced statistic can be specified. In addition to the graphical output, the query can be exported as a text of XML file.
Figure 4
Figure 4
Graphical output of d-matrix The graphical output consists of the matrices itself, the description of the nodes displayed, a prospect of statistical evaluations and hyperlinks to external resources. Each matrix corresponds to a single data group (Phenotypes; Sequence variations). The x-axis of the matrix is defined by the main ID (Record) and the y-axis by the nodes displayed. The terms like "Gender", "Age (Years)" and "IVS Shunt" are descriptive names for the respective column names GENDER, AGE_YEARS and IVS_SHUNT of table PATIENTS; terms like "Ichd0001" and "Ichd0002" refer to locus names, values of the column LOCUS_ID of table SEQ_VAR_LOCI. The matrix is built by colored boxes coding for the meaning of the information itself, which is further described in the pop-up window (as shown for Record 366 and Ichd0009). Frequency bars and boxes for descriptive statistics are displayed. Numbers are reflecting the sorting order, whereas blue boxes at the left border hold the hyperlinks.
Figure 5
Figure 5
Example of a data exploration session for CVGdb Shown are the first 61 of 211 records that meet the query condition "IVS shunt" is not "Null" focusing on different views of the data given by different sorting options (A, B, C). To provide information about the color code as well as the overall query output, pop-up windows for frequency bars of sorted nodes are shown (D). Further, the pop-up window for the correlation analysis between 'RV sys pressure' and PV Psys gradient' is displayed (D). See text for detailed description of the observed cluster.

References

    1. Fredman D, Munns G, Rios D, Sjoholm F, Siegfried M, Lenhard B, Lehvaslaiho H, Brookes AJ. HGVbase: a curated resource describing human DNA variation and phenotype relationships. Nucleic Acids Res. 2004;32:D516–519. doi: 10.1093/nar/gkh111. - DOI - PMC - PubMed
    1. Genome Web http://www.hgmp.mrc.ac.uk/GenomeWeb/
    1. Nadkarni PM. The challenges of recording phenotype in a generalizable and computable form. Pharmacogenomics J. 2003;3:8–10. doi: 10.1038/sj.tpj.6500153. - DOI - PMC - PubMed
    1. Kaynak B, von Heydebreck A, Mebus S, Seelow D, Hennig S, Vogel J, Sperling HP, Pregla R, Alexi-Meskishvili V, Hetzer R, Lange PE, Vingron M, Lehrach H, Sperling S. Genome-wide array analysis of normal and malformed human hearts. Circulation. 2003;107:2467–2474. doi: 10.1161/01.CIR.0000066694.21510.E2. - DOI - PubMed
    1. Walker AJ, Cross SS, Harrison RF. Visualisation of biomedical datasets by use of growing cell structure networks: a novel diagnostic classification technique. Lancet. 1999;354:1518–1521. doi: 10.1016/S0140-6736(99)02186-8. - DOI - PubMed

Publication types

LinkOut - more resources