

Dynamic model for ventricular junctional conductance during the cardiac action potential
- PMID: 15513960
- PMCID: PMC2752676
- DOI: 10.1152/ajpheart.00882.2004
Dynamic model for ventricular junctional conductance during the cardiac action potential
Abstract
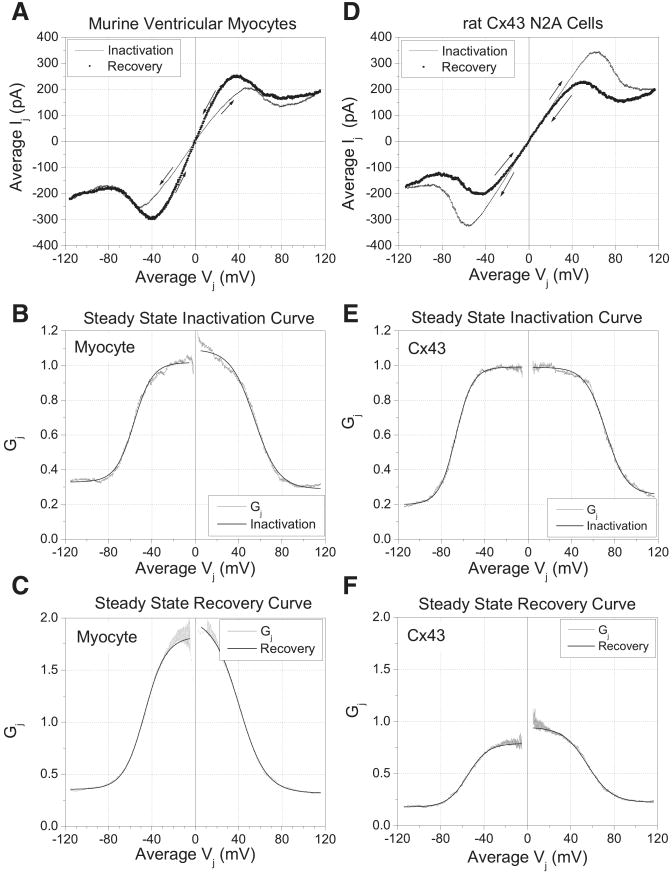
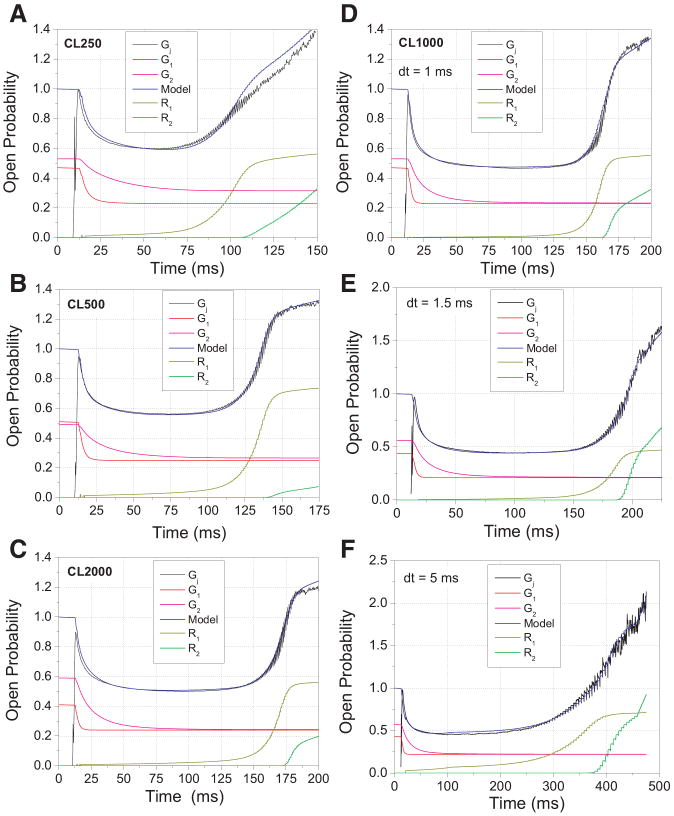
The ventricular action potential was applied to paired neonatal murine ventricular myocytes in the dual whole cell configuration. During peak action potential voltages >100 mV, junctional conductance (g(j)) declined by 50%. This transjunctional voltage (V(j))-dependent inactivation exhibited two time constants that became progressively faster with increasing V(j). G(j) returned to initial peak values during action potential repolarization and even exceeded peak g(j) values during the final 5% of repolarization. This facilitation of g(j) was observed <30 mV during linearly decreasing V(j) ramps. The same behavior was observed in ensemble averages of individual gap junction channels with unitary conductances of 100 pS or lower. Immunohistochemical fluorescent micrographs and immunoblots detect prominent amounts of connexin (Cx)43 and lesser amounts of Cx40 and Cx45 proteins in cultured ventricular myocytes. The time dependence of the g(j) curves and channel conductances are consistent with the properties of predominantly homomeric Cx43 gap junction channels. A mathematical model depicting two inactivation and two recovery phases accurately predicts the ventricular g(j) curves at different rates of stimulation and repolarization. Functional differences are apparent between ventricular myocytes and Cx43-transfected N2a cell gap junctions that may result from posttranslational modification. These observations suggest that gap junctions may play a role in the development of conduction block and the genesis and propagation of triggered arrhythmias under conditions of slowed conduction (<10 cm/s).
Figures


Similar articles
-
Connexin40 and connexin43 determine gating properties of atrial gap junction channels.J Mol Cell Cardiol. 2010 Jan;48(1):238-45. doi: 10.1016/j.yjmcc.2009.05.014. Epub 2009 May 30. J Mol Cell Cardiol. 2010. PMID: 19486903 Free PMC article.
-
Regulation of connexin43 gap junctional conductance by ventricular action potentials.Circ Res. 2003 Sep 19;93(6):e63-73. doi: 10.1161/01.RES.0000093379.61888.35. Epub 2003 Aug 28. Circ Res. 2003. PMID: 12946947
-
Expression and regulation of connexins in cultured ventricular myocytes isolated from adult rat hearts.Pflugers Arch. 2002 Mar;443(5-6):676-89. doi: 10.1007/s00424-001-0747-z. Epub 2002 Jan 15. Pflugers Arch. 2002. PMID: 11889564
-
Connexin-mediated cardiac impulse propagation: connexin 30.2 slows atrioventricular conduction in mouse heart.Trends Cardiovasc Med. 2006 Nov;16(8):266-72. doi: 10.1016/j.tcm.2006.05.002. Trends Cardiovasc Med. 2006. PMID: 17055382 Free PMC article. Review.
-
[Remodeling of cardiac gap junctions and arrhythmias].Sheng Li Xue Bao. 2011 Dec 25;63(6):586-92. Sheng Li Xue Bao. 2011. PMID: 22193455 Review. Chinese.
Cited by
-
Atrial fibrillation-associated connexin40 mutants make hemichannels and synergistically form gap junction channels with novel properties.FEBS Lett. 2014 Apr 17;588(8):1458-64. doi: 10.1016/j.febslet.2014.01.010. Epub 2014 Jan 20. FEBS Lett. 2014. PMID: 24457199 Free PMC article.
-
Properties of cardiac conduction in a cell-based computational model.PLoS Comput Biol. 2019 May 31;15(5):e1007042. doi: 10.1371/journal.pcbi.1007042. eCollection 2019 May. PLoS Comput Biol. 2019. PMID: 31150383 Free PMC article.
-
Connexin40 and connexin43 determine gating properties of atrial gap junction channels.J Mol Cell Cardiol. 2010 Jan;48(1):238-45. doi: 10.1016/j.yjmcc.2009.05.014. Epub 2009 May 30. J Mol Cell Cardiol. 2010. PMID: 19486903 Free PMC article.
-
Jasplakinolide reduces actin and tropomyosin dynamics during myofibrillogenesis.Cytoskeleton (Hoboken). 2014 Sep;71(9):513-29. doi: 10.1002/cm.21189. Epub 2014 Sep 12. Cytoskeleton (Hoboken). 2014. PMID: 25145272 Free PMC article.
-
Connexin diversity in the heart: insights from transgenic mouse models.Front Pharmacol. 2013 Jun 27;4:81. doi: 10.3389/fphar.2013.00081. Print 2013. Front Pharmacol. 2013. PMID: 23818881 Free PMC article.
References
-
- Alcoléa S, Théveniau-Ruissy M, Jarry-Ruchard T, Marics I, Tzouanacou E, Chauvin JP, Briand JP, Moorman AF, Lamers WH, Gros DB. Downregulation of connexin 45 gene products during mouse heart development. Circ Res. 1999;84:1365–1379. - PubMed
-
- Bastide B, Neyses L, Ganten D, Paul M, Willecke K, Traub O. Gap junction protein connexin40 is preferentially expressed in vascular endothelium and conductive bundles of rat myocardium and is increased under hypertensive conditions. Circ Res. 1993;73:1138–1149. - PubMed
-
- Beyer EC. Molecular cloning and developmental expression of two chick embryo gap junction proteins. J Biol Chem. 1990;265:14439–14443. - PubMed
-
- Bradford MM. A rapid and sensitive method for the quantitation of microgram quantities of protein using the principle of protein-dye binding. Anal Biochem. 1976;72:248–254. - PubMed
-
- Cooklin M, Wallis WRJ, Sheridan DJ, Fry CH. Changes in cell-to-cell electrical coupling associated with left ventricular hypertrophy. Circ Res. 1997;80:765–771. - PubMed
Publication types
MeSH terms
Substances
Grants and funding
LinkOut - more resources
Full Text Sources
Miscellaneous