. 2004 Oct 28;32(19):e147.
doi: 10.1093/nar/gnh146.

Hypervariable genes--experimental error or hidden dynamics

Affiliations

Hypervariable genes--experimental error or hidden dynamics

Igor Dozmorov et al. Nucleic Acids Res. .

Abstract

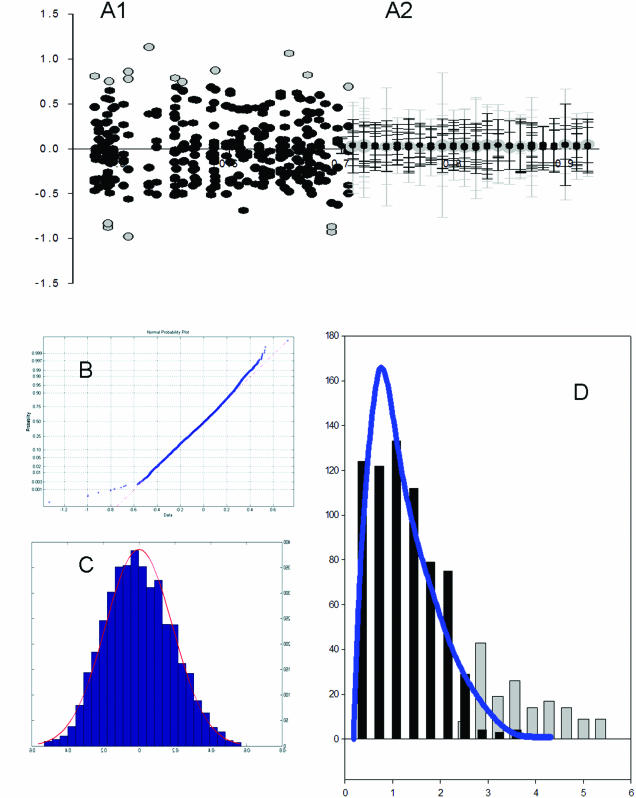
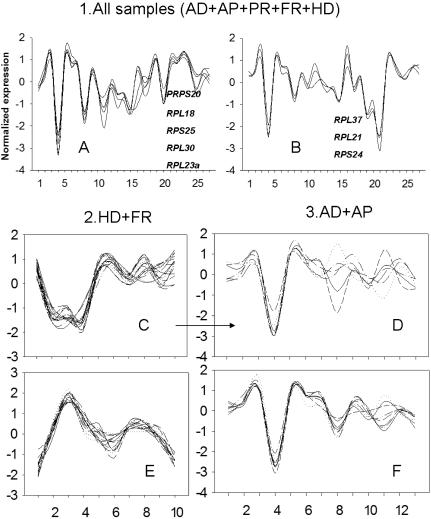
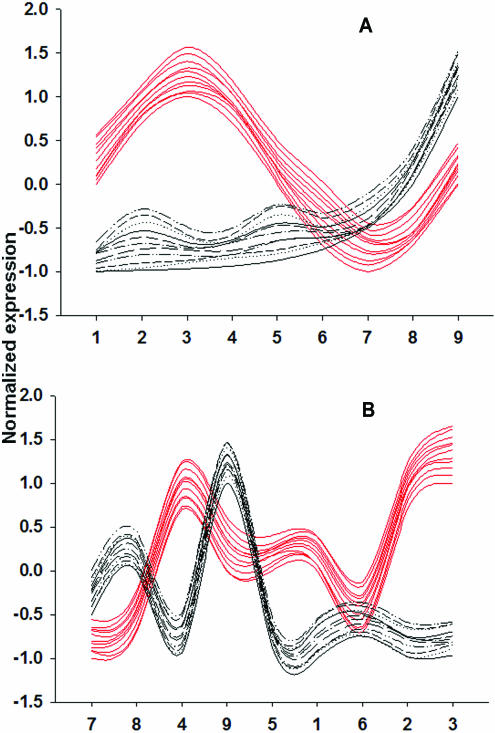
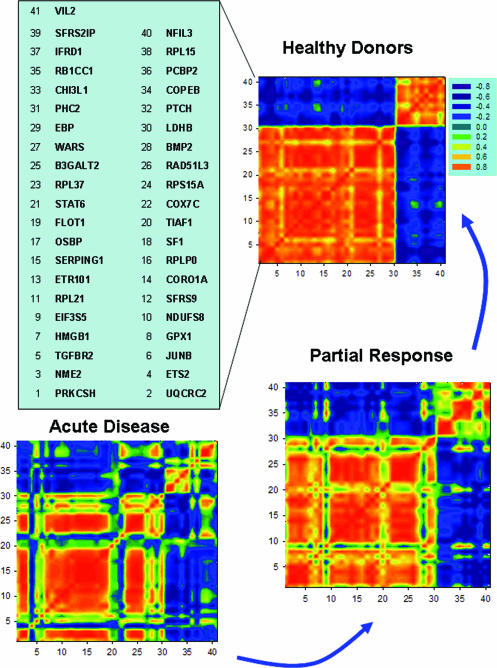
In a homogeneous group of samples, not all genes of high variability stem from experimental errors in microarray experiments. These expression variations can be attributed to many factors including natural biological oscillations or metabolic processes. The behavior of these genes can tease out important clues about naturally occurring dynamic processes in the organism or experimental system under study. We developed a statistical procedure for the selection of genes with high variability denoted hypervariable (HV) genes. After the exclusion of low expressed genes and a stabilizing log-transformation, the majority of genes have comparable residual variability. Based on an F-test, HV genes are selected as having a statistically significant difference from the majority of variability stabilized genes measured by the 'reference group'. A novel F-test clustering technique, further noted as 'F-means clustering', groups HV genes with similar variability patterns, presumably from their participation in a common dynamic biological process. F-means clustering establishes, for the first time, groups of co-expressed HV genes and is illustrated with microarray data from patients with juvenile rheumatoid arthritis and healthy controls.


Figures

Figure 1
Figure 1
(A1) Scatter plot of residuals derived from common regression line in a robust regression analysis as described in Materials and Methods. The points represent residuals where the black are of normal variability and the grey are outliers. (A2) A continuation of A1 where instead of points, the variability is expressed by error bars. The black represent expected variability and the grey signify HV genes. The determination of HV is different for each expression level and is determined by an F-test. (B) A normality plot revealing the normality of the log-transformed non-background spots. (C) A histogram of the log-transformed non-background spots superimposed by a red normal distribution line. (D) Vertical bar chart of the variance ratio between individual genes and the variability of the reference group. The black lines represent the ratio frequencies of non-HV genes. The blue line is a superimposed F-distribution showing expected frequencies. The grey bars show the frequency of HV genes as they distort the tail of the F-distribution.
Figure 2
Figure 2
(A and B) F-means clustering of genes from 27 patients and healthy controls [patients with acute disease (AD), non-responsive to the treatment (persistent) (AP), partially responsive to treatment (PR), demonstrating full response (FR) and from control group of healthy donors (HD)]. Here the two largest clusters are presented consisting exclusively of ribosomal genes. (C and E) The two largest clusters in combined HD and FR groups. (D and F) Gene clustering of two groups with acute disease. (D) Genes from largest cluster HD and FR (C) having similar patterns in AD and AP groups. (F) Largest cluster in AD and AP groups.
Figure 3
Figure 3
Diagrams illustrating the formation of the cluster profiles for HV genes in a homogeneous group. (A) Possible assortment of nine samples representing two dynamical processes with participation of several genes each whose profiles are shown in either red or black. (B) Variant of (A) in which only the order of samples was changed. This is valid since all samples were collected simultaneously and are part of a homogeneous group. The gene co-expression is preserved in all possible arrangements of samples and in these co-expressions is where F-means clustering can tease out the involvement of these genes in common dynamical processes.
Figure 4
Figure 4
Correlation mosaics for genes from the two largest clusters in the control group. Each spot in the plot presents correlation coefficients of expressions for genes along the axes. A red spot is highly correlated, conversely a blue spot is highly anti-correlated. Gene order is chosen to present joined co-expressed genes in two largest clusters of the HD samples. The same order of the genes along axis is used for all three mosaics.

References

    1. Jarvis N.J., Dozmorov,I., Jiang,K., Frank,M.B., Szodoray,P., Alex,P. and Centola,M. (2003) Novel approaches to gene expression analysis of active polyarticular juvenile rheumatoid arthritis. Arthritis Res. Ther., 6, R15–R31. - PMC - PubMed
    1. Dozmorov I.M. and Centola,M. (2003) An associative analysis of gene expression array data. Bioinformatics, 19, 204–211. - PubMed
    1. Dooley S., Herlitzka,I., Hanselmann,R., Ermis,A., Henn,W., Remberger,K., Hopf,T. and Welter,C. (1996) Constitutive expression of c-fos and c-jun, overexpression of ets-2, and reduced expression of metastasis suppressor gene nm23-H1 in rheumatoid arthritis. Ann. Rheum. Dis., 55, 298–304. - PMC - PubMed
    1. Ohtani N., Zebedee,Z., Huot,T.J.G., Stinson,J.A., Sugimoto,M., Ohashi,Y., Sharrocks,A.D., Peters,G. and Hara,E. (2001) Opposing effects of Ets and Id proteins on p16 (INK4A) expression during cellular senescence. Nature, 409, 1067–1070. - PubMed
    1. Taniguchi K., Kohsaka,H., Inoue,N., Terada,Y., Ito,H., Hirokawa,K. and Miyasaka,N. (1999) Induction of the p16INK4a senescence gene as a new therapeutic strategy for the treatment of rheumatoid arthritis. Nature Med., 5,760–767. - PubMed

Publication types