. 2004 Dec;75(6):948-65.
doi: 10.1086/425870. Epub 2004 Oct 8.

Comparison of microsatellites versus single-nucleotide polymorphisms in a genome linkage screen for prostate cancer-susceptibility Loci

Affiliations

Comparison of microsatellites versus single-nucleotide polymorphisms in a genome linkage screen for prostate cancer-susceptibility Loci

Daniel J Schaid et al. Am J Hum Genet. 2004 Dec.

Abstract

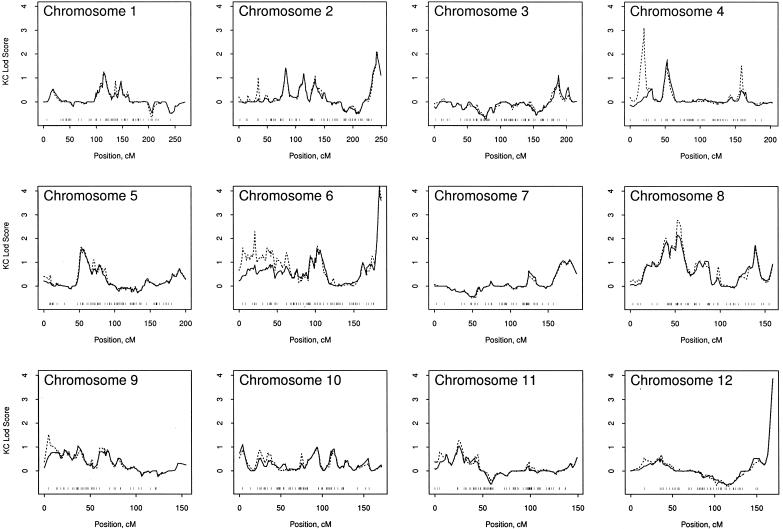
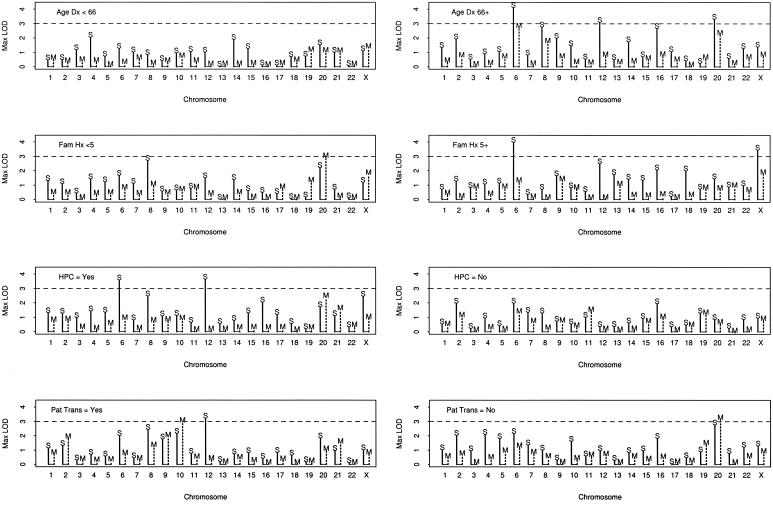
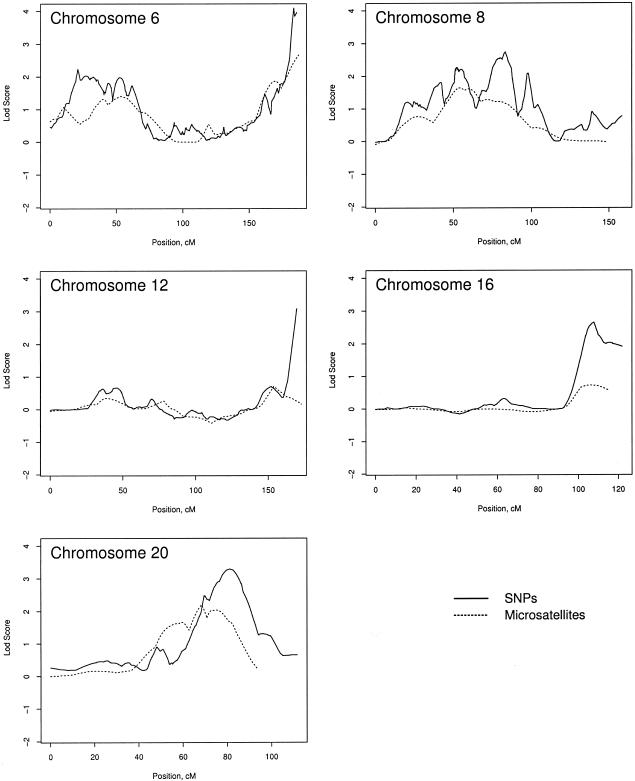
Prostate cancer is one of the most common cancers among men and has long been recognized to occur in familial clusters. Brothers and sons of affected men have a 2-3-fold increased risk of developing prostate cancer. However, identification of genetic susceptibility loci for prostate cancer has been extremely difficult. Although the suggestion of linkage has been reported for many chromosomes, the most promising regions have been difficult to replicate. In this study, we compare genome linkage scans using microsatellites with those using single-nucleotide polymorphisms (SNPs), performed in 467 men with prostate cancer from 167 families. For the microsatellites, the ABI Prism Linkage Mapping Set version 2, with 402 microsatellite markers, was used, and, for the SNPs, the Early Access Affymetrix Mapping 10K array was used. Our results show that the presence of linkage disequilibrium (LD) among SNPs can lead to inflated LOD scores, and this seems to be an artifact due to the assumption of linkage equilibrium that is required by the current genetic-linkage software. After excluding SNPs with high LD, we found a number of new LOD-score peaks with values of at least 2.0 that were not found by the microsatellite markers: chromosome 8, with a maximum model-free LOD score of 2.2; chromosome 2, with a LOD score of 2.1; chromosome 6, with a LOD score of 4.2; and chromosome 12, with a LOD score of 3.9. The LOD scores for chromosomes 6 and 12 are difficult to interpret, because they occurred only at the extreme ends of the chromosomes. The greatest gain provided by the SNP markers was a large increase in the linkage information content, with an average information content of 61% for the SNPs, versus an average of 41% for the microsatellite markers. The strengths and weaknesses of microsatellite versus SNP markers are illustrated by the results of our genome linkage scans.


Figures

Figure  1
Figure 1
Distribution of pairwise |D| values according to the pairwise distance of SNPs within 5 cM (top panel). The solid horizontal line in the top panel is the threshold for high LD at |D|>0.7. The distribution of the high-LD SNPs is given in the lower left panel, and the distribution of the pairwise distances between the high-LD SNPs is given in the lower right panel.
Figure  2
Figure 2
LOD scores for SNPs, shown with versus without the high-LD SNPs. In each panel, the solid line excludes the high-LD SNPs, and the broken line includes them. At the bottom of each panel are tick marks that indicate the positions of the high-LD SNPs.
Figure  2
Figure 2
LOD scores for SNPs, shown with versus without the high-LD SNPs. In each panel, the solid line excludes the high-LD SNPs, and the broken line includes them. At the bottom of each panel are tick marks that indicate the positions of the high-LD SNPs.
Figure  3
Figure 3
LOD scores for SNP markers (dotted line), M-STR markers (dashed line), and the combination of both SNPs and M-STRs (solid line). The bottom of each panel shows the information content of the three types of analyses.
Figure  3
Figure 3
LOD scores for SNP markers (dotted line), M-STR markers (dashed line), and the combination of both SNPs and M-STRs (solid line). The bottom of each panel shows the information content of the three types of analyses.
Figure  3
Figure 3
LOD scores for SNP markers (dotted line), M-STR markers (dashed line), and the combination of both SNPs and M-STRs (solid line). The bottom of each panel shows the information content of the three types of analyses.
Figure  4
Figure 4
Percentage of genome exceeding different levels of genetic information for SNP markers (dotted line), M-STR markers (dashed line), and the combination of SNPs and M-STRs (solid line).
Figure  5
Figure 5
Maximum LOD scores by subset, chromosome, and SNPs versus M-STRs. Age Dx = the mean age at diagnosis per pedigree; Fam Hx = the number of men with prostate cancer in a pedigree; HPC = hereditary prostate cancer by Carter criteria; Pat Trans = paternal transmission. The solid vertical line with the “S” indicates the SNP maximum LOD score, and the broken vertical line with the “M” indicates the M-STR maximum LOD score.
Figure  6
Figure 6
Example LOD-score plots for the subset of pedigrees with an average age at diagnosis of >66 years, to compare the LOD scores for SNPs versus M-STRs.

References

Electronic-Database Information

    1. Online Mendelian Inheritance in Man (OMIM), http://www.ncbi.nlm.nih.gov/Omim/ (for prostate cancer, HPC1, PCAP, CAPB, HPC2, HPC20, and HPCX)

References

    1. Abecasis G, Cherny S, Cookson W, Cardon L (2002) Merlin—rapid analysis of dense genetic maps using sparse gene flowtrees. Nat Genet 30:97–10110.1038/ng786 - DOI - PubMed
    1. Berry R, Schroeder JJ, French AJ, McDonnell SK, Peterson BJ, Cunningham JM, Thibodeau SN, Schaid DJ (2000) Evidence for a prostate cancer–susceptibility locus on chromosome 20. Am J Hum Genet 67:82–91 - PMC - PubMed
    1. Berthon P, Valeri A, Cohen-Akenine A, Drelon E, Paiss T, Wöhr G, Latil A, et al (1998) Predisposing gene for early-onset prostate cancer, localized on chromosome 1q42.2-43. Am J Hum Genet 62:1416–1424 - PMC - PubMed
    1. Boehnke M, Cox NJ (1997) Accurate inference of relationships in sib-pair linkage studies. Am J Hum Genet 61:423–429 - PMC - PubMed
    1. Carpten J, Nupponen N, Isaacs S, Sood R, Robbins C, Xu J, Faruque M, et al (2002) Germline mutations in the ribonuclease L gene in families showing linkage with HPC1. Nat Genet 30:181–18410.1038/ng823 - DOI - PubMed

Publication types