Citrate-permeable channels in the plasma membrane of cluster roots from white lupin
- PMID: 15516510
- PMCID: PMC527174
- DOI: 10.1104/pp.104.046201
Citrate-permeable channels in the plasma membrane of cluster roots from white lupin
Abstract
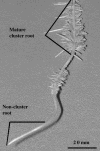
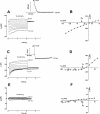
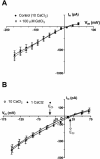
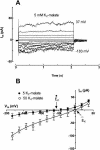
White lupin (Lupinus albus) is well adapted to phosphorus deficiency by developing cluster roots that release large amounts of citrate into the rhizosphere to mobilize the sparingly soluble phosphorus. To determine the mechanism underlying citrate release from cluster roots, we isolated protoplasts from different types of roots of white lupin plants grown in phosphorus-replete (+P) and phosphorus-deficient (-P) conditions and used the patch-clamp technique to measure the whole-cell currents flowing across plasma membrane of these protoplasts. Two main types of anion conductance were observed in protoplasts prepared from cluster root tissue: (1) an inwardly rectifying anion conductance (IRAC) activated by membrane hyperpolarization, and (2) an outwardly rectifying anion conductance (ORAC) that became more activated with membrane depolarization. Although ORAC was an outward rectifier, it did allow substantial inward current (anion efflux) to occur. Both conductances showed citrate permeability, with IRAC being more selective for citrate3- than Cl- (PCit/PCl = 26.3), while ORAC was selective for Cl- over citrate (PCl/PCit = 3.7). Both IRAC and ORAC were sensitive to the anion channel blocker anthracene-9-carboxylic acid. These currents were also detected in protoplasts derived from noncluster roots of -P plants, as well as from normal (noncluster) roots of plants grown with 25 microm phosphorus (+P). No differences were observed in the magnitude or frequency of IRAC and ORAC currents between the cluster roots and noncluster roots of -P plants. However, the IRAC current from +P plants occurred less frequently than in the -P plants. IRAC was unaffected by external phosphate, but ORAC had reduced inward current (anion efflux) when phosphate was present in the external medium. Our data suggest that IRAC is the main pathway for citrate efflux from white lupin roots, but ORAC may also contribute to citrate efflux.
Figures


Similar articles
-
Characterization of anion channels in the plasma membrane of Arabidopsis epidermal root cells and the identification of a citrate-permeable channel induced by phosphate starvation.Plant Physiol. 2004 Dec;136(4):4136-49. doi: 10.1104/pp.104.046995. Epub 2004 Nov 24. Plant Physiol. 2004. PMID: 15563625 Free PMC article.
-
A link between citrate and proton release by proteoid roots of white lupin (Lupinus albus L.) grown under phosphorus-deficient conditions?Plant Cell Physiol. 2005 Jun;46(6):892-901. doi: 10.1093/pcp/pci094. Epub 2005 Apr 8. Plant Cell Physiol. 2005. PMID: 15821025
-
Plasma membrane H-ATPase-dependent citrate exudation from cluster roots of phosphate-deficient white lupin.Plant Cell Environ. 2009 May;32(5):465-75. doi: 10.1111/j.1365-3040.2009.01938.x. Epub 2009 Jan 14. Plant Cell Environ. 2009. PMID: 19183296
-
Update on lupin cluster roots. Update on white lupin cluster root acclimation to phosphorus deficiency.Plant Physiol. 2011 Jul;156(3):1025-32. doi: 10.1104/pp.111.175174. Epub 2011 Apr 4. Plant Physiol. 2011. PMID: 21464472 Free PMC article. Review. No abstract available.
-
Plasma membrane anion channels in higher plants and their putative functions in roots.New Phytol. 2006;169(4):647-66. doi: 10.1111/j.1469-8137.2006.01639.x. New Phytol. 2006. PMID: 16441747 Review.
Cited by
-
White lupin cluster root acclimation to phosphorus deficiency and root hair development involve unique glycerophosphodiester phosphodiesterases.Plant Physiol. 2011 Jul;156(3):1131-48. doi: 10.1104/pp.111.173724. Epub 2011 Apr 4. Plant Physiol. 2011. PMID: 21464471 Free PMC article.
-
Lupins in the genome editing era: advances in plant cell culture, double haploid technology and genetic transformation for crop improvement.Front Plant Sci. 2025 Jun 24;16:1601216. doi: 10.3389/fpls.2025.1601216. eCollection 2025. Front Plant Sci. 2025. PMID: 40630729 Free PMC article. Review.
-
Root traits confer grain yield advantages under terminal drought in chickpea (Cicer arietinum L.).Field Crops Res. 2017 Feb 1;201:146-161. doi: 10.1016/j.fcr.2016.11.004. Field Crops Res. 2017. PMID: 28163361 Free PMC article.
-
Nitrogen and Phosphorus Interplay in Lupin Root Nodules and Cluster Roots.Front Plant Sci. 2021 Mar 3;12:644218. doi: 10.3389/fpls.2021.644218. eCollection 2021. Front Plant Sci. 2021. PMID: 33747024 Free PMC article. Review.
-
miR156 modulates rhizosphere acidification in response to phosphate limitation in Arabidopsis.J Plant Res. 2016 Mar;129(2):275-84. doi: 10.1007/s10265-015-0778-8. Epub 2015 Dec 11. J Plant Res. 2016. PMID: 26659856
References
-
- Amtmann A, Sanders D (1997) A unified procedure for the correction of liquid junction potentials in patch clamp experiments on endo- and plasma membranes. J Exp Bot 48: 361–364 - PubMed
-
- Barbara JG, Stoeckel H, Takeda K (1994) Hyperpolarization-activated inward chloride current in protoplasts from suspension-cultured carrot cells. Protoplasma 180: 136–144
-
- Barbier-Brygoo H, Vinauger M, Colcombet J, Ephritikhine G, Frachisse J-M, Maurel C (2000) Anion channels in higher plants: functional characterization and physiological role. Biochim Biophys Acta 1465: 199–218 - PubMed
-
- Dietrich P, Hedrich R (1994) Interconversion of fast and slow gating modes of GCACl, a guard cell anion channel. Planta 195: 301–304
MeSH terms
Substances
LinkOut - more resources
Full Text Sources

