. 2004 Nov;186(22):7618-25.
doi: 10.1128/JB.186.22.7618-7625.2004.

Continuous control in bacterial regulatory circuits

Affiliations

Continuous control in bacterial regulatory circuits

Eric Batchelor et al. J Bacteriol. 2004 Nov.

Abstract

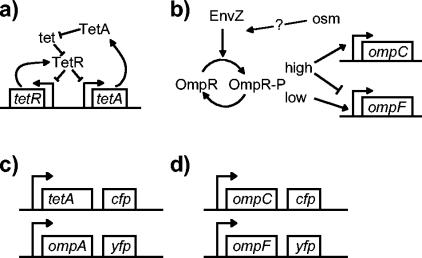
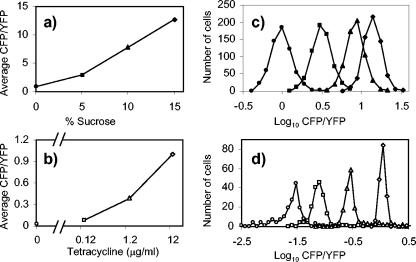
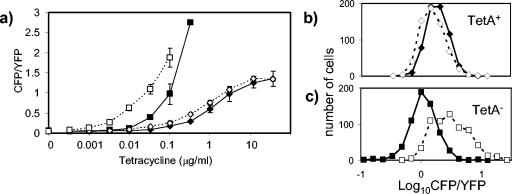
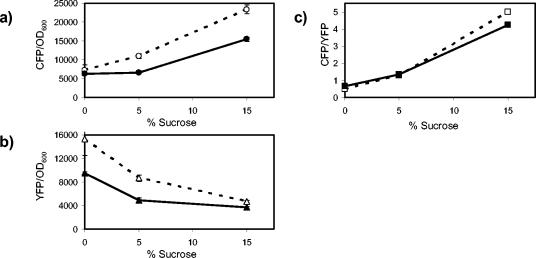
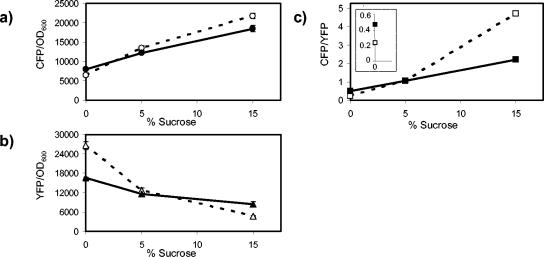
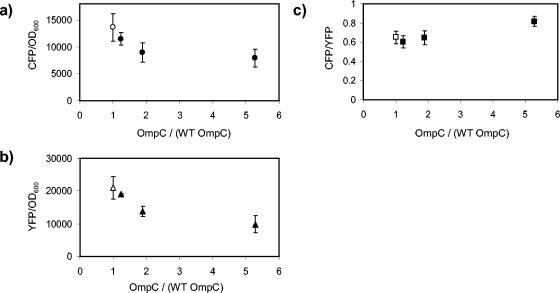
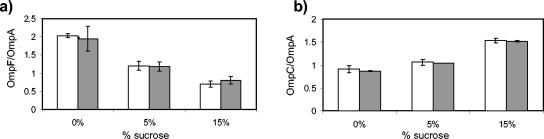
We show that for two well-characterized regulatory circuits in Escherichia coli, Tn10 tetracycline resistance and porin osmoregulation, the transcriptional outputs in individual cells are graded functions of the applied stimuli. These systems are therefore examples of naturally occurring regulatory circuits that exhibit continuous control of transcription. Surprisingly, however, we find that porin osmoregulation is open loop; i.e., the porin expression level does not feed back into the regulatory circuit. This mode of control is particularly interesting for an organism such as E. coli, which proliferates in diverse environments, and raises important questions regarding the biologically relevant inputs and outputs for this system.


Figures

FIG. 1.
FIG. 1.
(a) The Tn10 tetracycline resistance circuit. (b) The porin osmoregulatory circuit. (c, d) To measure transcription in single cells, strains were constructed in which operon fusions of tetA with cfp and ompA with yfp (c) or ompC with cfp and ompF with yfp (d) were integrated into the chromosome.
FIG. 2.
FIG. 2.
Histograms of cellular CFP/YFP fluorescence of cultures with varying osmolarity (a, c) or varying tetracycline concentration (b, d). The values in panels a and b are the averages of the corresponding values from the histograms in panels c and d. E. coli cells were MDG131 (a, c) and MDG149 (b, d). Cultures were grown in minimal glycerol medium supplemented with 0 (•), 5 (▪), 10, (▴), or 15% (⧫) sucrose (a, c) or 0 (○), 0.12 (□), 1.2 (▵), or 12.0 μg (◊) of tetracycline/ml (b, d). For 0 μg of tetracycline/ml, the CFP fluorescence was so low that the signal was dominated by cellular autofluorescence (data not shown). The scale for fluorescence measurements in the CFP and YFP channels is arbitrary.
FIG. 3.
FIG. 3.
(a) Transcription from the tetA promoter in MDG150 (TetA) and MDG149 (TetA+) cells in response to tetracycline in rich and minimal media; MDG150 in LB (▪), MDG150 in minimal A glucose medium plus Casamino Acids (□), MDG149 in LB (⧫), and MDG149 in minimal A glucose medium plus Casamino Acids (◊). The growth rates were identical for all samples grown in minimal medium. The growth rates for cells grown in LB were identical except for MDG150 in the presence of 333 μg of tetracycline/ml (the highest concentration of tetracycline shown for MDG150), which exhibited a decreased growth rate. Each measurement was the average fluorescence ratio of at least 100 cells. The CFP/YFP values shown are the averages of results from at least three independent experiments, and the error bars are the corresponding standard deviations (the error bars are smaller than the data symbols in some cases). (b) The distributions of cellular CFP/YFP fluorescence are similar for MDG149 (TetA+) colonies growing on minimal glycerol agar with 12 μg of tetracycline/ml (◊) and on LB agar with 12 μg of tetracycline/ml (⧫). (c) The distribution of cellular CFP/YFP fluorescence for MDG150 (TetA) colonies growing on minimal glycerol agar with 50 ng of tetracycline/ml (□) is broader than for growth on LB agar with 50 ng of tetracycline/ml (▪). Higher levels of tetracycline were used for MDG149 in order to obtain average levels of fluorescence that were comparable to the levels seen for MDG150.
FIG. 4.
FIG. 4.
Effect of in-frame deletions in ompC on ompC and ompF transcription. Open symbols, MDG131 (OmpC+); filled symbols, EPB16 (OmpC). (a) CFP fluorescence (ompC transcription) normalized by culture OD600. (b) YFP fluorescence (ompF transcription) normalized by OD600. (c) The ratio of CFP fluorescence to YFP fluorescence. All points represent the averages of results from at least three independent experiments. The error bars, which denote the corresponding standard deviations, are smaller than the data symbols in most cases.
FIG. 5.
FIG. 5.
Effect of in-frame deletions in ompF on ompC and ompF transcription. Open symbols, MDG147 (OmpF+); filled symbols, EPB24 (OmpF). (a) CFP fluorescence (ompC transcription) normalized by culture OD600. (b) YFP fluorescence (ompF transcription) normalized by culture optical density. (c) The ratio of CFP fluorescence to YFP fluorescence. The inset in panel c displays the 0% sucrose points for MDG147 and EPB24 with an expanded scale on the y axis; see the text for a discussion. All points represent the averages of results from at least three independent experiments. The error bars, which denote the corresponding standard deviations, are smaller than the data symbols in most cases.
FIG. 6.
FIG. 6.
Effect of OmpC overexpression on ompC and ompF transcription. Fluorescence measurements of CFP and YFP normalized by culture OD600 and the corresponding fluorescence ratios for MDG131/pEB19 with various levels of IPTG induction (filled symbols). The OmpC protein level was normalized by the wild-type (WT) value, which was taken to be the OmpC level of MDG131/pTrc99a (open symbols). Cultures were grown in an intermediate-osmolarity medium (5% sucrose). Similar results were obtained for high- and low-osmolarity cultures (15 and 0% sucrose [data not shown]). The points represent the averages of results from at least three independent experiments, and the error bars denote the corresponding standard deviations.
FIG. 7.
FIG. 7.
Effects of an ompC deletion on OmpF protein levels and an ompF deletion on OmpC protein levels. (a) White bars, MDG131 (OmpC+); grey bars, EPB16 (OmpC). (b) White bars, MDG147 (OmpF+); grey bars, EPB24 (OmpF). Cultures were grown in minimal glycerol medium supplemented with the indicated concentrations of sucrose. Western blots were performed with antibodies that cross-react with both porins and with the structural protein OmpA. The data in panels a and b represent the averages of results from three and two independent measurements, respectively, and the error bars denote the corresponding standard deviations.

References

    1. Achtman, M., A. Mercer, B. Kusecek, A. Pohl, M. Heuzenroeder, W. Aaronson, A. Sutton, and R. P. Silver. 1983. Six widespread bacterial clones among Escherichia coli K1 isolates. Infect. Immun. 39:315-335. - PMC - PubMed
    1. Alphen, W. V., and B. Lugtenberg. 1977. Influence of osmolarity of the growth medium on the outer membrane protein pattern of Escherichia coli. J. Bacteriol. 131:623-630. - PMC - PubMed
    1. Amann, E., B. Ochs, and K. J. Abel. 1988. Tightly regulated tac promoter vectors useful for the expression of unfused and fused proteins in Escherichia coli. Gene 69:301-315. - PubMed
    1. Bachman, B. J. 1996. Derivations and genotypes of some mutant derivatives of Escherichia coli K-12, p. 2460-2488. In F. C. Neidhardt, R. Curtis, J. L. Ingraham, E. C. C. Lin, K. B. Low, B. Magasanik, W. S. Reznikoff, M. Riley, M. Schaecter, and H. E. Umbarger (ed.), Escherichia coli and Salmonella: cellular and molecular biology, 2nd ed., vol. 2. ASM Press, Washington, D.C.
    1. Bagowski, C. P., and J. E. Ferrell, Jr. 2001. Bistability in the JNK cascade. Curr. Biol. 11:1176-1182. - PubMed

Publication types

MeSH terms