Long-term renormalization of chromatic mechanisms following cataract surgery
- PMID: 15518204
- PMCID: PMC2633455
- DOI: 10.1017/s0952523804213025
Long-term renormalization of chromatic mechanisms following cataract surgery
Abstract
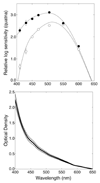
The optical density of the human crystalline lens progressively increases with age, the greatest increase in the visible spectrum being at short wavelengths. This produces a gradual shift in the spectral distribution of the light reaching the retina, yet color appearance remains relatively stable across the life span, implying that the visual system adapts to compensate for changes in spectral sensitivity. We explored properties of this adaptive renormalization by measuring changes in color appearance following cataract surgery. When the lens is removed, cataract patients often report a large perceptual shift in color appearance that can last for months. This change in color appearance was quantified for four cataract patients (63-84 years) by determining the chromaticity of stimuli that appeared achromatic before surgery, and at various intervals after surgery for up to 1 year. Stimuli were presented on a calibrated CRT as 9.5-deg spots, with 3-s duration and 3-s interstimulus intervals (ISIs). Chromaticity was adjusted by the subjects in CIE L*a*b* color space with luminance fixed at 32 cd/m2, on a dark background. We also estimated the optical density of the cataractous lens by comparing absolute scotopic thresholds from 410 nm to 600 nm before and after surgery. The results demonstrated that immediately following surgery there is a large increase in the short-wave light reaching the retina, mainly below 500 nm. The achromatic settings generally showed an initial large shift in the "yellow" direction after surgery that gradually (but never fully) returned to the original achromatic point before surgery. The shifts in the achromatic point occur over a number of months and appear to occur independently of the fellow eye.
Figures


References
-
- Arend LE, Reeves A. Simultaneous color constancy. Journal of the Optical Society of America A. 1986;3:1743–1751. - PubMed
-
- Ayama M, Suda N, Narisada K. Proceedings of the International Workshop on Gerontechnology. Tsukuba, Japan: National Institute of Bioscience and Human Technology; 2001. Color appearance of elderly observer with and without intraocular lens; pp. 81–82.
-
- Bauml KH. Simultaneous color constancy: How surface color perception varies with the illuminant. Vision Research. 1999;39:1531–1550. - PubMed
-
- Brainard DH. The psychophysics toolbox. Spatial Vision. 1997;10:433–436. - PubMed
-
- Brainard DH. Color constancy in the nearly natural image. 2. Achromatic loci. Journal of the Optical Society of America A. 1998;15:307–325. - PubMed

