

Genome size variation and evolution in Veronica
- PMID: 15520022
- PMCID: PMC4242286
- DOI: 10.1093/aob/mch219
Genome size variation and evolution in Veronica
Abstract
Background and aims: The amount of DNA per chromosome set is known to be a fairly constant characteristic of a species. Its interspecific variation is enormous, but the biological significance of this variation is little understood. Some of the characters believed to be correlated with DNA amount are alpine habitat, life history and breeding system. In the present study, the aim is to distinguish between direct causal connections and chance correlation of the amount of DNA in the genus Veronica.
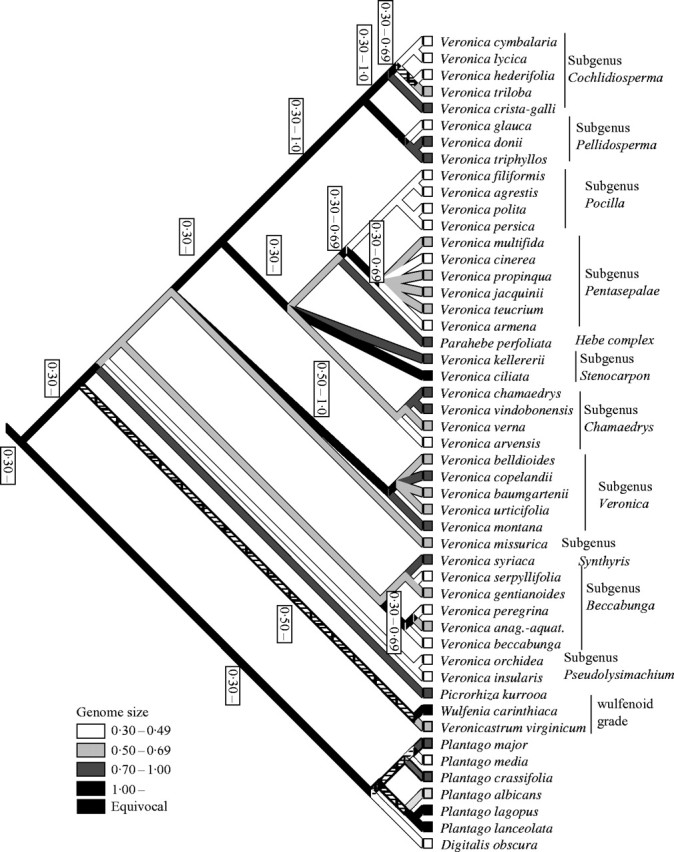
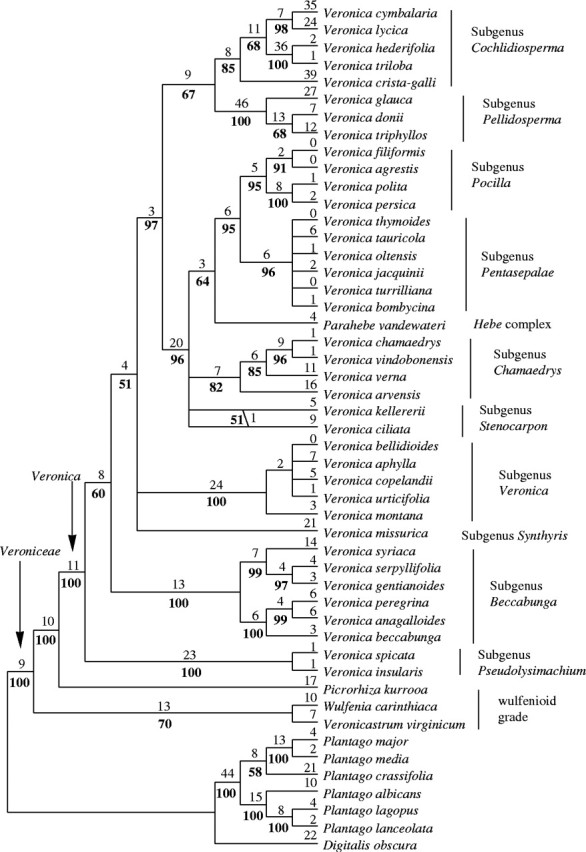
Methods: Estimates of DNA amount were analysed for 42 members of Veroniceae in connection with results from a phylogenetic analysis of plastid trnL-F DNA sequences and tested correlations using standard statistical tests, phylogenetically independent contrasts and a model-based generalized least squares method to distinguish the phylogenetic effect on the results.
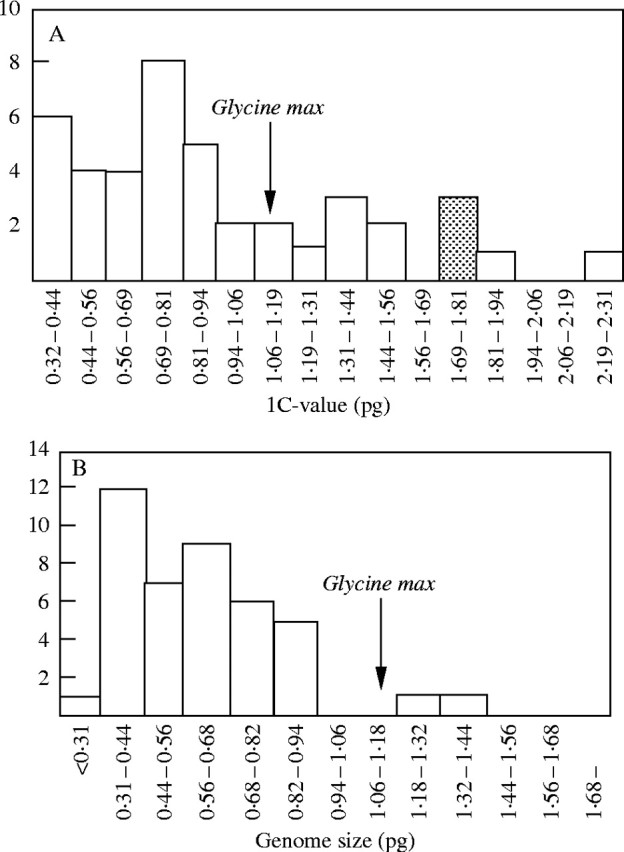
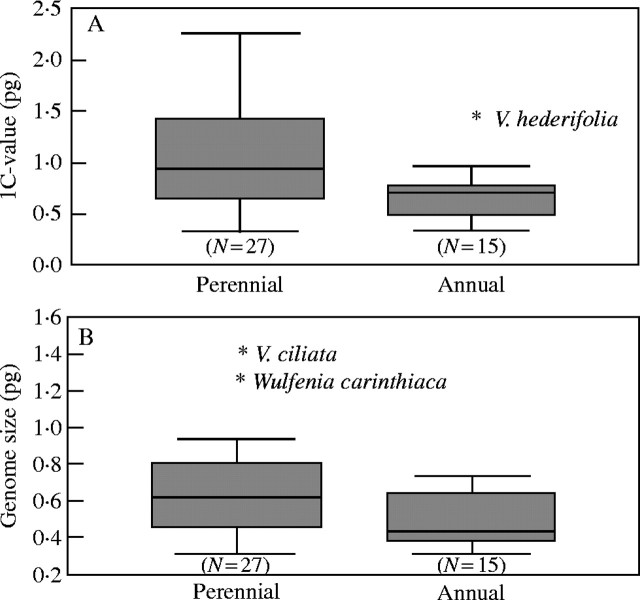
Key results: There appears to be a lower upper limit for DNA amount in annuals than in perennials. Most DNAC-values in Veroniceae are below the mean DNA C-value for annuals in angiosperms as a whole. However, the long-debated correlation of low genome size with annual life history is not significant (P = 0.12) using either standard statistical tests or independent contrasts, but it is significant with the generalized least squares method (P < 0.01).
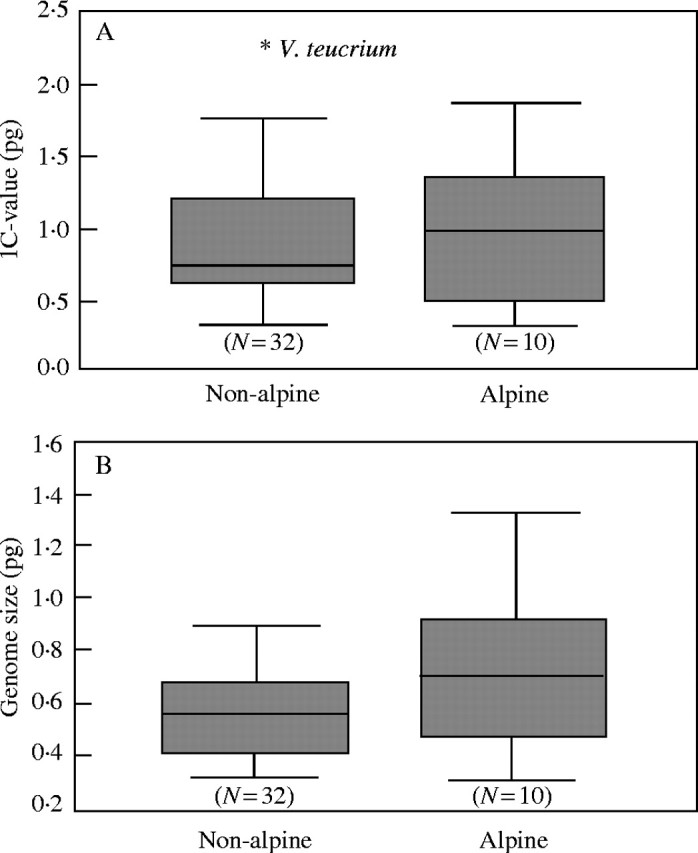
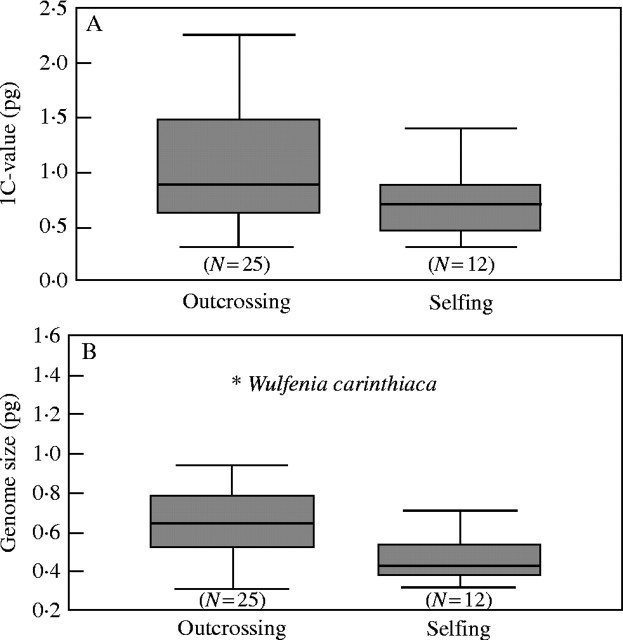
Conclusions: The correlation of annual life history and low genome size found in earlier studies could be due to the association of annual life history and selfing, which is significantly correlated with low genome size using any of the three tests applied. This correlation can be explained by models showing a reduction in transposable elements in selfers. A significant correlation of higher genome sizes with alpine habitats was also detected.
Figures
Similar articles
-
Evolutionary rates in Veronica L. (Plantaginaceae): disentangling the influence of life history and breeding system.J Mol Evol. 2010 Jan;70(1):44-56. doi: 10.1007/s00239-009-9307-5. Epub 2009 Dec 19. J Mol Evol. 2010. PMID: 20024538
-
Phylogeny of Veronica in the Southern and Northern Hemispheres based on plastid, nuclear ribosomal and nuclear low-copy DNA.Mol Phylogenet Evol. 2010 Feb;54(2):457-71. doi: 10.1016/j.ympev.2009.09.030. Epub 2009 Sep 29. Mol Phylogenet Evol. 2010. PMID: 19796701
-
Correlated evolution of LTR retrotransposons and genome size in the genus Eleocharis.BMC Plant Biol. 2010 Nov 30;10:265. doi: 10.1186/1471-2229-10-265. BMC Plant Biol. 2010. PMID: 21118487 Free PMC article.
-
Has the connection between polyploidy and diversification actually been tested?Curr Opin Plant Biol. 2016 Apr;30:25-32. doi: 10.1016/j.pbi.2016.01.002. Epub 2016 Feb 8. Curr Opin Plant Biol. 2016. PMID: 26855304 Review.
-
The origin, evolution and proposed stabilization of the terms 'genome size' and 'C-value' to describe nuclear DNA contents.Ann Bot. 2005 Jan;95(1):255-60. doi: 10.1093/aob/mci019. Ann Bot. 2005. PMID: 15596473 Free PMC article. Review.
Cited by
-
Evolutionary rates in Veronica L. (Plantaginaceae): disentangling the influence of life history and breeding system.J Mol Evol. 2010 Jan;70(1):44-56. doi: 10.1007/s00239-009-9307-5. Epub 2009 Dec 19. J Mol Evol. 2010. PMID: 20024538
-
Relative DNA content in diploid, polyploid, and multiploid species of Paspalum (Poaceae) with relation to reproductive mode and taxonomy.J Plant Res. 2016 Jul;129(4):697-710. doi: 10.1007/s10265-016-0813-4. Epub 2016 Mar 10. J Plant Res. 2016. PMID: 26965283
-
Large vs small genomes in Passiflora: the influence of the mobilome and the satellitome.Planta. 2021 Apr 1;253(4):86. doi: 10.1007/s00425-021-03598-0. Planta. 2021. PMID: 33792791
-
Chromosome numbers and DNA content in some species of Mecardonia (Gratiolae, Plantaginaceae).Comp Cytogenet. 2016 Dec 14;10(4):769-780. doi: 10.3897/CompCytogen.v10i4.10362. eCollection 2016. Comp Cytogenet. 2016. PMID: 28123693 Free PMC article.
-
Horizontally Acquired nrDNAs Persist in Low Amounts in Host Hordeum Genomes and Evolve Independently of Native nrDNA.Front Plant Sci. 2021 May 17;12:672879. doi: 10.3389/fpls.2021.672879. eCollection 2021. Front Plant Sci. 2021. PMID: 34079572 Free PMC article.
References
-
- Ackerly, DD. 2000. Taxon sampling, correlated evolution, and independent contrasts. Evolution 54: 1480–1492. - PubMed
-
- Albach DC, Chase MW. 2001. Paraphyly of Veronica (Veroniceae;Scrophulariaceae): evidence from the internal transcribed spacer (ITS) sequences of nuclear ribosomal DNA. Journal of PlantResearch 114: 9–18.
-
- Albach DC, Martínez-Ortega MM, Chase MW. 2004.Veronica: parallel morphological evolution and phylogeography in the Mediterranean. Plant Systematics and Evolution 246: 177–194.
-
- Albach DC, Martínez-Ortega MM, Chase MW, Fischer MA. 2004. Evolution of Veroniceae: a phylogenetic perspective. Annals of the Missouri Botanical Garden 91: 275–302.
-
- Albach DC, Martínez-Ortega MM, Chase MW, Fischer MA. 2004. Classification of Veroniceae: problems and possible solution. Taxon 53: 429–452.
