. 2004 Nov 8;167(3):433-43.
doi: 10.1083/jcb.200405102. Epub 2004 Nov 1.

A cell sizer network involving Cln3 and Far1 controls entrance into S phase in the mitotic cycle of budding yeast

Affiliations

A cell sizer network involving Cln3 and Far1 controls entrance into S phase in the mitotic cycle of budding yeast

Lilia Alberghina et al. J Cell Biol. .

Abstract

Saccharomyces cerevisiae must reach a carbon source-modulated critical cell size, protein content per cell at the onset of DNA replication (Ps), in order to enter S phase. Cells grown in glucose are larger than cells grown in ethanol. Here, we show that an increased level of the cyclin-dependent inhibitor Far1 increases cell size, whereas far1 Delta cells start bud emergence and DNA replication at a smaller size than wild type. Cln3 Delta, far1 Delta, and strains overexpressing Far1 do not delay budding during an ethanol glucose shift-up as wild type does. Together, these findings indicate that Cln3 has to overcome Far1 to trigger Cln-Cdc28 activation, which then turns on SBF- and MBF-dependent transcription. We show that a second threshold is required together with the Cln3/Far1 threshold for carbon source modulation of Ps. A new molecular network accounting for the setting of Ps is proposed.


Figures

Figure 1.
Figure 1.
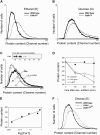
A functional extracellular glucose sensing system is required to properly set cell size (P) and protein content required for S phase initiation (Ps). (A) Size of wild-type cells (thick line), isogenic gpa2Δ cells (dashed line), and gpr1Δ cells (thin line) exponentially growing in ethanol (SCE medium) determined by FACS analysis of total cell protein after FITC staining. (B) Same as A for cells exponentially growing in glucose (SCD medium). (C) Immunoblot showing Cln3 protein level in wild-type and isogenic gpa2Δ and gpr1Δ cells grown in SCD and SCE (lanes labeled D and E, respectively). Extracts were loaded and bands quantified as detailed in Materials and methods. The values of average P, critical P at the beginning of DNA replication (Ps) determined by cytofluorimetric analysis (see Materials and methods for details), and duplication time (T) and length of budded phase (Tb) were determined for wild-type cells (black bars), gpa2Δ cells (white), and gpr1Δ cells (dashed) exponentially growing in SCE and SCD. (D) Cln3 protein levels determined as detailed above, were plotted as a function of Ps for wild-type cells (diamonds), gpa2Δ cells (circles), gpr1Δ cells (triangles), and wild-type cells overexpressing Cln3 (squares). Closed symbols indicate cells grown in SCD, open symbols indicate cells grown in SCE. Either average ± SD of data derived from experiments repeated at least three times (C and D, bar chart) or representative results from one of such experiments (A, B, and Western blot in C) are shown.
Figure 2.
Figure 2.
The FAR1 gene is involved in cell size setting under both steady-state and transient growth conditions. (A) Size of wild-type cells (thick line) and far1Δ cells overexpressing FAR1 under the control of a Tet-repressible promoter (FAR1tet strain, thin line) during exponential growth in ethanol (SCE medium) determined by FACS analysis of total cell protein after FITC staining. (B). Same as A for cells exponentially growing in glucose (SCD medium). (C) FAR1 expression in a FAR1tet strain exponentially growing in SCE was switched off by addition of doxocycline at time 0. Far1 protein levels (top) and the average P (FACS analysis protein profile) were measured at the indicated time after doxocycline addition. (D) Average P from FACS analysis of untreated cells (closed circles), and after treatment with 0.02 μg/ml doxocycline (open circles) and 2 μg/ml doxocycline (open triangles). (E) Correlation between cellular P and intracellular Far1 level determined from quantification of immunoblot bands as detailed in Materials and methods. (F) Size of wild-type, FAR1tet, and the FAR1N393-tet strains, the latter overexpressing a truncated form of Far1, during exponential growth in SCE determined by FACS analysis of total cell protein after FITC staining. Experiments were repeated twice with superimposable results. Representative results from one of these experiments are shown.
Figure 3.
Figure 3.
FAR1 deletion partially uncouples budding and DNA synthesis and alters timing and cell size of S phase entry. Wild-type and far1Δ cells were grown in SCD, elutriated as reported in Materials and methods and small cells refed with fresh prewarmed SCD at time 0. (A) Percentage of budded cells determined by microscopic observation (a minimum of 300 cells were counted for each time point) for wild-type cells (closed circles) and far1Δ cells (open circles). (B) DNA FACS distributions of wild-type cells synchronized by centrifugal elutriation and released in fresh SCD medium were determined every 10 min after refeeding. The percentage of budded cells and of cells with DNA content greater then 1c (S+G2+M) is indicated on the right side. (C) Same as in B for far1Δ cells. The single black arrow in the left side of B and C indicates the time point in which wild-type and far1Δ cells had the same volume (26 fl) as determined by coulter counter analysis. (D) Percentage of S+G2+M cells determined FACS analysis for wild-type cells (closed circles) and far1Δ cells (open circles). (E) Cln3 protein level were evaluated by Western blot analysis in wild-type (W303-p strain) and in far1Δ cells (far1Δ-p strain) exponentially growing in glucose (SCD medium); quantities of crude extracts loaded are indicated. (F) The percentage of budded cells and of S+G2+M cells from A and D are plotted as function of relative cell volume, where the initial volume of both cell types at time 0 was made equal to 1. Experiments were repeated twice with superimposable results. Representative results from one of these experiments are shown.
Figure 4.
Figure 4.
Far1-dependent delay of budding in an ethanol to glucose nutritional shift up. (A) Far1 and Cln3 protein levels in wild-type and FAR1 overexpressing strain (FAR1tet): both strains were grown in SCE (E) and SCD (D) and mid log phase cells were collected for protein extraction followed by Western blot analysis with anti-Myc antibodies as detailed in Materials and methods. (B) At time 0 2% glucose was added to cells exponentially growing in SCE medium and samples were collected to evaluate the percentage of budded cells in wild-type (black), far1Δ (red), cln3Δ (green), and FAR1 overexpressing (FAR1tet, blue) strains. (C) Western blots of Far1 and Cln3 proteins from cells overexpressing FAR1 (FAR1tet strain) during an ethanol/glucose shift up. (D) Western blot of Far1 and Cln3 proteins from wild-type cells (W303-CF strain) during an ethanol/glucose shift-up. (E) Cln3 (green) and Far1 (red) protein levels and their ratio (blue) were determined during ethanol/glucose shift-up by quantification of Western blot bands of wild-type cells (W303-CF strain) as detailed in Materials and methods. Percentage of budded cells (black) and Cln3/Far1 mean values ratio (blue) are also plotted as a function of time. Protein levels shown are average ± SD of data derived from independent experiments repeated at least twice. Blots shown are representative of experiments repeated at least twice with similar results.
Figure 5.
Figure 5.
Carbon source modulation of cell size is totally lost when both Far1- and Sic1-dependent thresholds are disrupted. (A) Size of wild-type cells and isogenic single or double mutants exponentially growing in medium supplemented with ethanol (SCE, open distributions) or glucose (SCD, gray distributions) by FACS analysis of total cell protein after FITC staining. (B) Mean values of P distributions of wild-type cells and deletion mutant cells in A exponentially growing in glucose and in ethanol were determined by FACS analysis (the complete set of mean values and SDs from three independent experiments is reported in Fig. S2); the ratio between mean value in glucose, P(D), and mean value in ethanol, P(E), is indicated as D/E ratio and is shown in the histogram for wild-type and each deletion mutant (black bars). In the same way and for the same cells, Ps were determined by FACS analysis (see Fig. S2 for values and Materials and methods for details). The corresponding D/E ratios for Ps are shown in the histogram as white bars. Shaded areas cover a 20% variation of D/E ratio around ordinate values of 1 (absence of carbon source–dependent modulation of size) and 2 (full wild-type modulation). (C) At time 0 2% glucose was added to cells exponentially growing in SCE medium and samples were collected to evaluate the percentage of budded cells. Wild type (closed circles), sic1Δ (open circles), and cln3Δsic1Δ (open triangles).
Figure 6.
Figure 6.
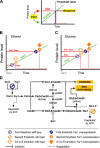
Molecular blueprint of the network controlling the G1 to S transition in budding yeast. (A) Schematic representation of a molecular threshold: the antagonistic effect of an activator (cyclin, green) and an inhibitor (Cki, red) sets the threshold for the response (blue). (B) Effect of Far1 overexpression on the G1 to S transition execution (large arrows) in cells growing in ethanol, and (C) in cells growing in glucose. The Cln3/Far1 threshold (blue) is set by the level of Far1 (red line) received by newborn cells. The threshold is executed when Cln3 (green line), exceeds Far1 and is made irreversible by Far1 degradation (red dotted line). The second threshold (orange) is set by Sic1 degradation. (D) Model of a two threshold network for the control of the G1 to S transition.

Similar articles

Cited by

References

    1. Alberghina, L., and D. Porro. 1993. Quantitative flow cytometry: analysis of protein distributions in budding yeast. A mini-review. Yeast. 9:815–823. - PubMed
    1. Alberghina, L., C. Smeraldi, B.M. Ranzi, and D. Porro. 1998. Control by nutrients of growth and cell cycle progression in budding yeast, analyzed by double-tag flow cytometry. J. Bacteriol. 180:3864–3872. - PMC - PubMed
    1. Alberghina, L., D. Porro, and L. Cazzador. 2001. Towards a blueprint of the cell cycle. Oncogene. 20:1128–1134. - PubMed
    1. Baroni, M.D., E. Martegani, P. Monti, and L. Alberghina. 1989. Cell size modulation by CDC25 and RAS2 genes in Saccharomyces cerevisiae. Mol. Cell. Biol. 9:2715–2723. - PMC - PubMed
    1. Baroni, M.D., P. Monti, G. Marconi, and L. Alberghina. 1992. cAMP-mediated increase in the critical cell size required for the G1 to S transition in Saccharomyces cerevisiae. Exp. Cell Res. 201:299–306. - PubMed

Publication types