. 2004 Nov;14(11):2347-56.
doi: 10.1101/gr.2739104.

A novel, high-performance random array platform for quantitative gene expression profiling

Affiliations

A novel, high-performance random array platform for quantitative gene expression profiling

Kenneth Kuhn et al. Genome Res. 2004 Nov.

Abstract

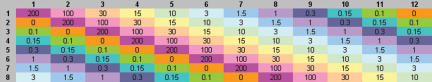
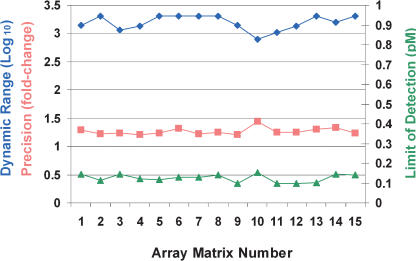
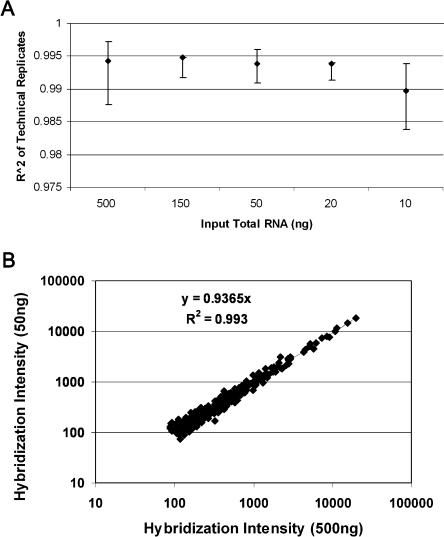
We have developed a new microarray technology for quantitative gene-expression profiling on the basis of randomly assembled arrays of beads. Each bead carries a gene-specific probe sequence. There are multiple copies of each sequence-specific bead in an array, which contributes to measurement precision and reliability. We optimized the system for specific and sensitive analysis of mammalian RNA, and using RNA controls of defined concentration, obtained the following estimates of system performance: specificity of 1:250,000 in mammalian poly(A(+)) mRNA; limit of detection 0.13 pM; dynamic range 3.2 logs; and sufficient precision to detect 1.3-fold differences with 95% confidence within the dynamic range. Measurements of expression differences between human brain and liver were validated by concordance with quantitative real-time PCR (R(2) = 0.98 for log-transformed ratios, and slope of the best-fit line = 1.04, for 20 genes). Quantitative performance was further verified using a mouse B- and T-cell model system. We found published reports of B- or T-cell-specific expression for 42 of 59 genes that showed the greatest differential expression between B- and T-cells in our system. All of the literature observations were concordant with our results. Our experiments were carried out on a 96-array matrix system that requires only 100 ng of input RNA and uses standard microtiter plates to process samples in parallel. Our technology has advantages for analyzing multiple samples, is scalable to all known genes in a genome, and is flexible, allowing the use of standard or custom probes in an array.


Figures

Figure 1.
Figure 1.
Design of a randomly assembled gene-specific probe array. (A) Representation of an individual bead lodged in a well. Attached to the bead by its 5′ end is a chimeric oligonucleotide ∼75 nucleotides in length, comprising an ∼25-nucleotide identifier sequence and a 50-nucleotide gene-specific probe. The bead identifier sequence is decoded using an algorithm described previously (Gunderson et al. 2004). We tested gene-specific probes of 25 and 50 bp in length and found that the 50 mers showed superior performance, consistent with prior findings (Hughes et al. 2001). The drawing is not to scale; the relative size of the oligonucleotide has been vastly exaggerated to show its features. (B) There are ∼50,000 beads in an ∼1.4-mm diameter optical fiber bundle, each bead lodged in a well at the end of an individual fiber in the bundle. (C) The bundles are arranged in a 96-array matrix matching the format of a standard microtiter plate.
Figure 2.
Figure 2.
Arrangement of spiked samples for hybridization. Each sample was produced by adding labeled spike controls to labeled complex RNA derived from human HepG2 poly(A+) RNA. The spike controls were added at the pM concentrations indicated in the figure. All nine spiked mRNAs were present at the same concentration within a given sample (e.g., 200 pM in sample a1). Samples were arranged in a staggered fashion to avoid the possibility of row/column positional bias. Hybridization was performed using 1 μg of each sample at a final concentration of 25 ng/μL.
Figure 3.
Figure 3.
Dose-response curves. Data points represent the mean of eight arrays. Signal intensities are plotted in blue vs. target concentration. Error bars represent the two-sided symmetric 90% confidence intervals for a single reading, calculated on the basis of the spread of eight separate readings. All points contain error bars, but some are too small to be resolved at the plotted scale. The resolvable fold change is plotted in red and green vs. target concentration. Each data point estimates the ability to distinguish concentration fold change for a single reading. Concentration levels are defined as resolved when estimated one-sided 95% confidence intervals do not overlap. Values below twofold are colored green, whereas those greater than twofold are colored red.
Figure 4.
Figure 4.
Dynamic range, detectable fold change, and limit of detection for 15 array matrices. The array matrices, manufactured on five separate days, were used to perform dose-response experiments identical to that described above, except in these experiments, we used four replicates per concentration instead of eight. Dynamic range corresponds to the concentration range over which twofold concentration changes can be distinguished with 95% confidence (represented by the green portions of the lines in Fig. 3); the values plotted in the graph (blue diamonds, left axis) are determined by dividing the upper concentration limit of this range by the lower limit for the given experiment. Precision (orange squares, left axis) corresponds to the distinguishable fold change across the determined dynamic range. Limit of detection (green triangles, right axis) corresponds to 0.99 detection p-value generated using normal model of intensities of 20 negative control probes that have no corresponding target in the sample. All performance values given represent the median value for the nine spike targets used in the experiment.
Figure 5.
Figure 5.
Array signal variation as a function of gene hybridization intensity. Each blue dot represents a gene and the red line represents a smoothed function for the data on the basis of a robust best-fit function for standard deviation vs. intensity. All values are based on background-subtracted raw data from 48 replicate hybridizations. The data shown are from one experiment of the 15 described in the legend to Figure 4. This experiment was chosen to represent the others on the basis of its measurement precision, which is the median of measurement precisions for all 15 experiments.
Figure 6.
Figure 6.
Sample labeling reproducibility. (A) Twenty sample labeling reactions were processed using our standard conditions with 10, 20, 50, 150, or 500 ng of total mouse spleen RNA as input material (four replicates each). For each input amount, correlation values (R2) of gene signals were determined for all pairwise comparisons of all successful replicates. The median R2 values, with ranges, are plotted. (B) Representative scatter plot of the intensity values for all genes measured in one of the 50-ng samples vs. those in the 500-ng sample. Whereas initial sample input varied for each labeling reaction, final array hybridization was performed using 1 μg of each labeled sample at a final concentration of 25 ng/μL.
Figure 7.
Figure 7.
Correlation of array matrix data to quantitative real-time PCR. Labeled RNA samples were made from human and brain total RNA. These were hybridized to separate array matrices containing 633 human genes. Six technical replicates were included for each sample. Twenty-one genes from this list were selected for analysis by TaqMan quantitative real-time PCR. A scatter plot of hybridization intensities of the liver and brain samples on the array matrix is shown in A. Genes selected for further analysis are shaded orange. A scatter plot of log-transformed hybridization signal ratios as determined by the two methods is shown in B.
Figure 8.
Figure 8.
B Cell/T Cell experimental results. Seven RNA samples were prepared containing mixtures of B- and T-cell lymphoma cell-line mRNA. The samples contained 0%, 5%, 25%, 50%, 95%, and 100% B-cell RNA, with the balance in all cases being T-cell RNA. These samples were labeled by our standard protocol and hybridized to six separate arrays each. (A) The hybridization intensities of the 59 most tissue-specific genes are plotted. Each vertical stripe represents a sample and each horizontal row a gene. Boxes represent the mean hybridization intensities measured in six replicate array hybridizations. The intensity scale is shown in the legend at the bottom. Genes are labeled according to their RefSeq or UniGene ID numbers. The colors of these labels indicate prior evidence in the literature of B- or T-cell-specific expression (red refers to B-cell-specific expression; blue refers to T-cell-specific; see Table 2 for references). (B) The dose responses of two representative genes identified in this experiment are plotted. Points represent the mean intensities for each concentration. Error bars represent 90% two-sided confidence intervals calculated from six replicate hybridizations.

References

    1. Abbas, A.K., Lichtman, A.H., and Pober, J.S. 2003. Cellular and molecular immunology. W.B. Saunders, Philadelphia, PA.
    1. Altschul, S.F., Gish, W., Miller, W., Myers, E.W., and Lipman, D.J. 1990. Basic local alignment search tool. J. Mol. Biol. 215: 403-410. - PubMed
    1. Barker, D.L., Therault, G., Che, D., Dickinson, T., Shen, R., and Kain, R. 2003. Self-assembled random arrays: High-performance imaging and genomics applications on a high-density microarray platform. Proc. SPIE 4966: 1-11.
    1. Blanchard, A. 1998. Synthetic DNA arrays. Plenum Press, New York.
    1. Brody, J.P., Williams, B.A., Wold, B.J., and Quake, S.R. 2002. Significance and statistical errors in the analysis of DNA microarray data. Proc. Natl. Acad. Sci. 99: 12975-12978. - PMC - PubMed

WEB SITE REFERENCES

    1. www.hapmap.org; International HapMap Project.
    1. www.illumina.com; Illumina, Inc.
    1. www.mged.org; Microarray Gene Expression Data Society.

LinkOut - more resources