. 2004 Nov 9;101(45):15955-60.
doi: 10.1073/pnas.0407114101. Epub 2004 Nov 1.

Identification of hair cycle-associated genes from time-course gene expression profile data by using replicate variance

Affiliations

Identification of hair cycle-associated genes from time-course gene expression profile data by using replicate variance

Kevin K Lin et al. Proc Natl Acad Sci U S A. .

Abstract

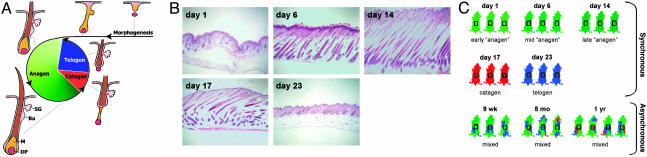
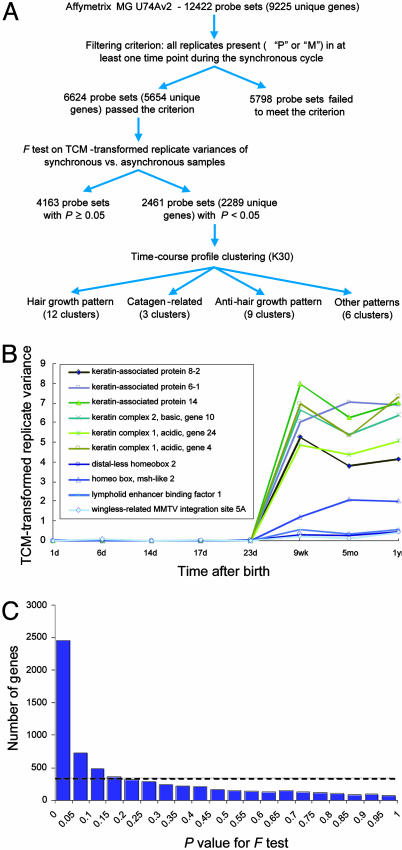
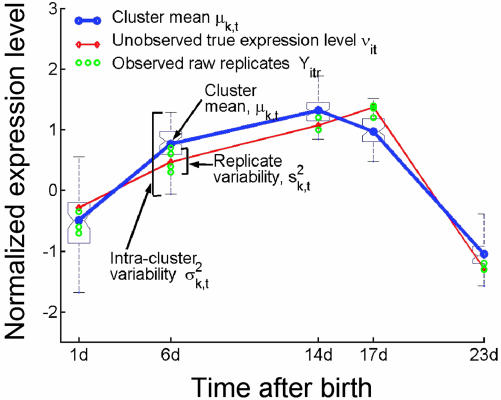
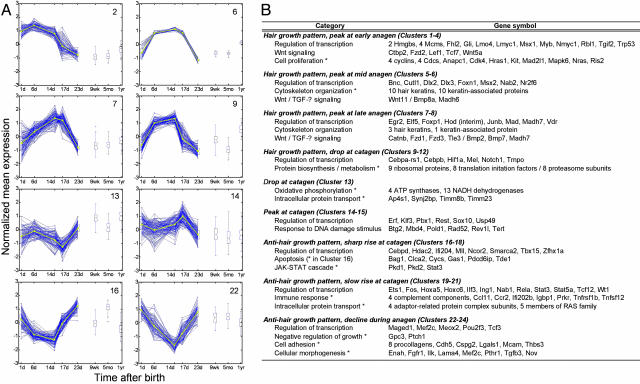
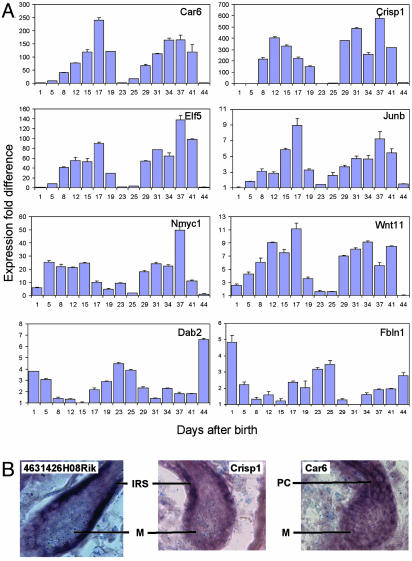
The hair-growth cycle is an example of a cyclic process that is well characterized morphologically but understood incompletely at the molecular level. As an initial step in discovering regulators in hair-follicle morphogenesis and cycling, we used DNA microarrays to profile mRNA expression in mouse back skin from eight representative time points. We developed a statistical algorithm to identify the set of genes expressed within skin that are associated specifically with the hair-growth cycle. The methodology takes advantage of higher replicate variance during asynchronous hair cycles in comparison with synchronous cycles. More than one-third of genes with detectable skin expression showed hair-cycle-related changes in expression, suggesting that many more genes may be associated with the hair-growth cycle than have been identified in the literature. By using a probabilistic clustering algorithm for replicated measurements, these genes were grouped into 30 time-course profile clusters, which fall into four major classes. Distinct genetic pathways were characteristic for the different time-course profile clusters, providing insights into the regulation of hair-follicle cycling and suggesting that this approach is useful for identifying hair follicle regulators. In addition to revealing known hair-related genes, we identified genes that were not previously known to be hair cycle-associated and confirmed their temporal and spatial expression patterns during the hair-growth cycle by quantitative real-time PCR and in situ hybridization. The same computational approach should be generally useful for identifying genes associated with cyclic processes from complex tissues.


Figures

Fig. 1.
Fig. 1.
Design of microarray experiments on mouse skin. (A) Hair-follicle morphogenesis and cycling. Representative hair follicles for the embryonic morphogenesis and each phase of the postnatal hair cycle are shown. Bu, bulge; DP, dermal papilla; M, matrix; SG, sebaceous gland. (B) Histological sections of mouse back skin for the first five time points of the experiment, showing hair follicles at different phases of the hair-growth cycle. (C) Overview of experimental design, showing the number of mice that were independently analyzed for each time point. The progression of anagen is indicated by different shades of green. Catagen and telogen are indicated by red and blue, respectively. The back skins of 9-week-old, 5-month-old, and 1-year-old mice are asynchronously cycling, containing mosaic patches of different phases of the hair-growth cycle. The rectangular box indicates the region of the back skin that was excised from all mice.
Fig. 2.
Fig. 2.
Identification of hair-cycle-associated genes. (A) Overview of data processing and results of profile clustering. (B) TCM-transformed replicate variance for 10 representative genes known to be associated with the hair-growth cycle. In comparison with the first five time points (synchronous), the last three time points (asynchronous) have significantly higher TCM-transformed replicate variances for all 10 genes (P < 0.0001). (C) Frequency distribution of P values for F test comparing replicate variance during the synchronous and asynchronous time points. The frequency distribution of the P values is plotted by using a bin increment of 0.05. Dashed line indicates the uniform distribution expected under the null hypothesis.
Fig. 3.
Fig. 3.
Probabilistic approach to clustering data with replicated measurements using mixture models. To incorporate input data in the form of replicated observations per gene per time point (green circles), we extended the standard mixture model by introducing an additional set of latent variables that encode unobserved true expression levels for a given gene per time point (red line). The resulting model allows decoupling of the intracluster variance and the replicate variance into two separate terms. The generative process is as follows. For each gene, sample its cluster k, and for each time point t, sample the unobserved true gene expression level vit by using cluster mean value μkt and intracluster variability σ2kt. Last, sample replicates by using the true gene-expression level vit, and replicate variability s2kt. All continuous-valued distributions are assumed to be Gaussian, and discrete distributions are multinomials.
Fig. 4.
Fig. 4.
Representative time-course profile clusters and selected genes of interest within the clusters. (A) Representative examples of profile clusters. Clusters 2, 6, and 7 display hair growth patterns that peak at early, middle, and late anagen, respectively. Cluster 9 also displays a hair growth pattern but shows a sharp decline in expression level at catagen. Cluster 13 drops at catagen, whereas cluster 14 peaks at that phase of the hair-growth cycle. Clusters 16 and 22 display anti-hair-growth patterns that rise sharply at catagen and decline during anagen, respectively. For each time point, the standard deviation and the minimum and maximum values for each cluster are shown. Blue lines, expression profiles for individual genes. Yellow lines, mean expression profile for clusters. (B) Selective genes of interest within different clusters. ease (Expression Analysis Systematic Explorer, available at http://david.niaid.nih.gov/david/ease.htm) software was used to identify overrepresented gene categories. *, ease score of <0.05.
Fig. 5.
Fig. 5.
Experimental validation of statistical algorithms for identifying hair-cycle-associated genes from skin microarray data. (A) qr-PCR results of gene expression for time points covering the first two synchronous hair cycles. Representative time points for the first hair-growth cycle: PN 1, 5, 8, 12, and 15 (anagen); 17 and 19 (catagen); and 23 (telogen). Representative time points for the second hair-growth cycle: PN 25, 29, 31, and 34 (anagen); 37 and 41 (catagen); and 44 (telogen). Standard deviations and mean fold differences in expression for each time point were calculated by using three replicates. (B) In situ hybridization localizing 4631426H08Rik (homolog of a type I keratin expressed in the inner root sheath), Crisp1, and Car6 in PN 3 mouse back skin. IRS, inner root sheath; M, matrix; PC, precortex.

References

    1. Stenn, K. S. & Paus, R. (2001) Physiol. Rev. 81, 449–494. - PubMed
    1. Fuchs, E., Merrill, B. J., Jamora, C. & DasGupta, R. (2001) Dev. Cell 1, 13–25. - PubMed
    1. Taylor, G., Lehrer, M. S., Jensen, P. J., Sun, T. T. & Lavker, R. M. (2000) Cell 102, 451–461. - PubMed
    1. Oshima, H., Rochat, A., Kedzia, C., Kobayashi, K. & Barrandon, Y. (2001) Cell 104, 233–245. - PubMed
    1. Tumbar, T., Guasch, G., Greco, V., Blanpain, C., Lowry, W. E., Rendl, M. & Fuchs, E. (2004) Science 303, 359–363. - PMC - PubMed

Publication types