. 2004 Nov 9;101(45):16046-51.
doi: 10.1073/pnas.0403299101. Epub 2004 Nov 1.

Dopamine transporters depolarize neurons by a channel mechanism

Affiliations

Dopamine transporters depolarize neurons by a channel mechanism

Lucia Carvelli et al. Proc Natl Acad Sci U S A. .

Abstract

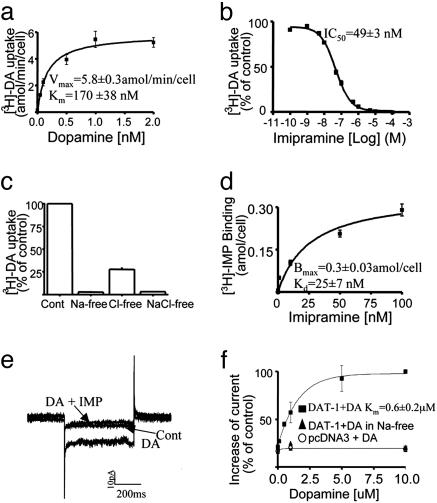
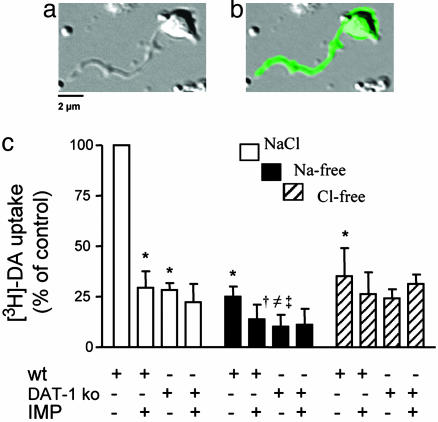
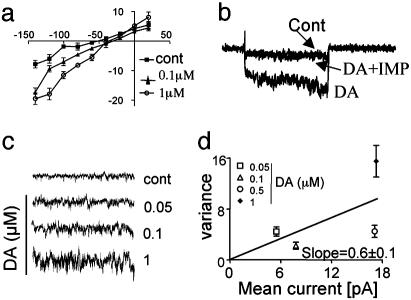
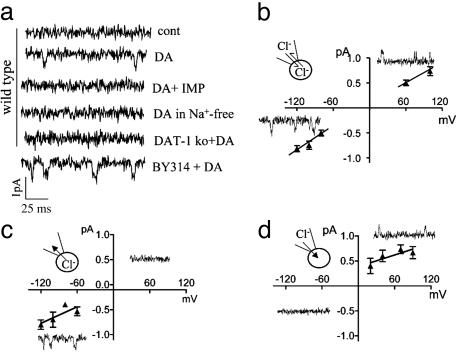
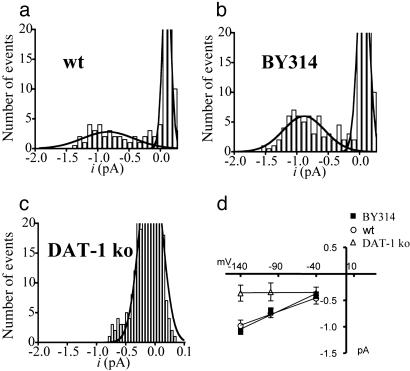
Neurotransmitter transporters generate larger currents than expected if one assumes fixed stoichiometry models. It remains controversial, however, whether these depolarizing currents arise from high density and rapid turnover rates of a classical transporter, or whether transporters exhibit bona fide channel behavior. Although heterologously expressed transporters show single-channel behavior and noise analysis in native cells strongly suggests channel behavior, no directly observed single-channel events associated with transporters have been reported thus far in native cells. We describe single-channel events arising directly from the Caenorhabditis elegans dopamine transporter (DAT-1) as evidenced by DA-induced channel activity blocked by a high-affinity DAT-1 inhibitor, increased channel activity in neurons that overexpress DAT-1, and loss of channels in dat-1 knockout neurons. Our data indicate that authentic transporter channels underlie depolarizing whole-cell currents. Thus, DA transporters not only transport DA but also exhibit a channel mode of conduction that directly modulates membrane potential and neuronal function.


Figures

Fig. 1.
Fig. 1.
Functional and electrophysiological characterization of DAT-1 in transiently transfected tsA-201 cells. (a) saturation kinetics of DA transport induced by DAT-1. (b) Inhibition of [3H]-DA transport induced by DAT-1 by IMP. (c) Ion dependence of [3H]-DA uptake measured in Na+-, Cl-, or NaCl-free buffer. (d) Saturation binding of [3H]-IMP to DAT-1-transfected cells. [3H]-DA was used at 50 nM in a and c; in a, DA concentrations higher than 50 nM were achieved by altering [3H]-DA specific activity with unlabeled DA. Data are derived from at least three independent experiments. Individual data points were obtained in quadruplicate. (e) Representative traces of whole-cell patch-clamp currents. (f) Concentration dependence of DA-mediated currents measured at –120 mV (six to nine cells per point). The steady-state currents recorded at each concentration were normalized to the current recorded in DAT-1-transfected cells perfused with 10 μM DA. DA-induced (10 μM) inward currents (–22 ± 13 pA at –120 mV) were not detected when Na+ ions were replaced by NMDG+ (▴) or when the cells were transfected with pcDNA3 empty vector (○).
Fig. 2.
Fig. 2.
DA transport in C. elegans neurons. (a) Differential interference contrast image of a typical Pdat-1::GFP (WT) C. elegans DA neuron shown as a GFP image in b.(c) Ionic dependence and inhibitor sensitivity of DA transport in C. elegans neurons. * and † indicate significant differences vs. WT in NaCl and Na+-free buffer, respectively. ≠ and ‡ indicate significant differences vs. DAT-1 ko in NaCl and Cl-free buffer, respectively. Means were compared by using one-way ANOVA and with P ≤ 0.01.
Fig. 3.
Fig. 3.
Whole-cell recordings in C. elegans neurons. (a) A representative recording of the current–voltage relationship elicited in the absence (▪) and presence of 0.1 (▴) and 1 (○) μM DA. (b) DA-mediated inward currents, recorded when the membrane potential was held at –40 and stepped to –100 mV, were blocked by IMP. (c) Extracellular DA application increased whole-cell current noise when the holding potential was held at –40 and stepped to –120 mV (n = 7). (d) Channel amplitude calculated as the slope of the linear regression curve obtained by plotting the mean currents and the variances measured when 0.05–1 μM DA were sequentially applied. Data are averages of six independent patches.
Fig. 4.
Fig. 4.
Transporter channels in C. elegans DA neurons. (a) Channel events from WT and BY314 C. elegans DA neurons in outside-out patches at –120 mV. (bd) Single-channel amplitude recorded in cell-attached configuration and plotted vs. the voltage, when the extracellular Cl concentration on both sides of the patch was equal to (b) or was lower (c) or higher (d) than the intracellular Cl.
Fig. 5.
Fig. 5.
Single-channel analyses of DAT-1 currents recorded at –120 mV. (ac) Representative amplitude histograms from an outside-out patch containing DA-induced single-channel events in WT (a), BY314 (b), and dat-1 ko (c) cells. Single-channel event amplitude measure in a and b was –0.8 ± 0.1 and 0.9 ± 0.06 pA, respectively. (d) Plot of single-channel amplitude vs. membrane potential in the presence of 1 μMDAofWT(○), BY314 (▪), and dat-1 ko (▵) DA neurons. In dat-1 ko neurons we recorded only background currents (±0.3 pA). Each symbol represents the mean ± SEM.

References

    1. Uhl, G. R., Javitch, J. A. & Snyder, S. H. (1985) Lancet 1, 956–957. - PubMed
    1. Kilty, J. E., Lorang, D. & Amara, S. G. (1991) Science 254, 578–579. - PubMed
    1. Lorang, D., Amara, S. G. & Simerly, R. B. (1994) J. Neurosci. 14, 4903–4914. - PMC - PubMed
    1. Ciliax, B. J., Heilman, C., Demchyshyn, L. L., Pristupa, Z. B., Ince, E., Hersch, S. M., Niznik, H. B. & Levey, A. I. (1995) J. Neurosci. 15, 1714–1723. - PMC - PubMed
    1. Sesack, S. R., Hawrylak, V. A., Matus, C., Guido, M. A. & Levey, A. I. (1998) J. Neurosci. 18, 2697–2708. - PMC - PubMed

Publication types

MeSH terms

LinkOut - more resources