. 2004 Nov 1;32(19):5800-8.
doi: 10.1093/nar/gkh914. Print 2004.

Complex patterns of transcription at the insertion site of a retrotransposon in the mouse

Affiliations

Complex patterns of transcription at the insertion site of a retrotransposon in the mouse

Riki Druker et al. Nucleic Acids Res. .

Abstract

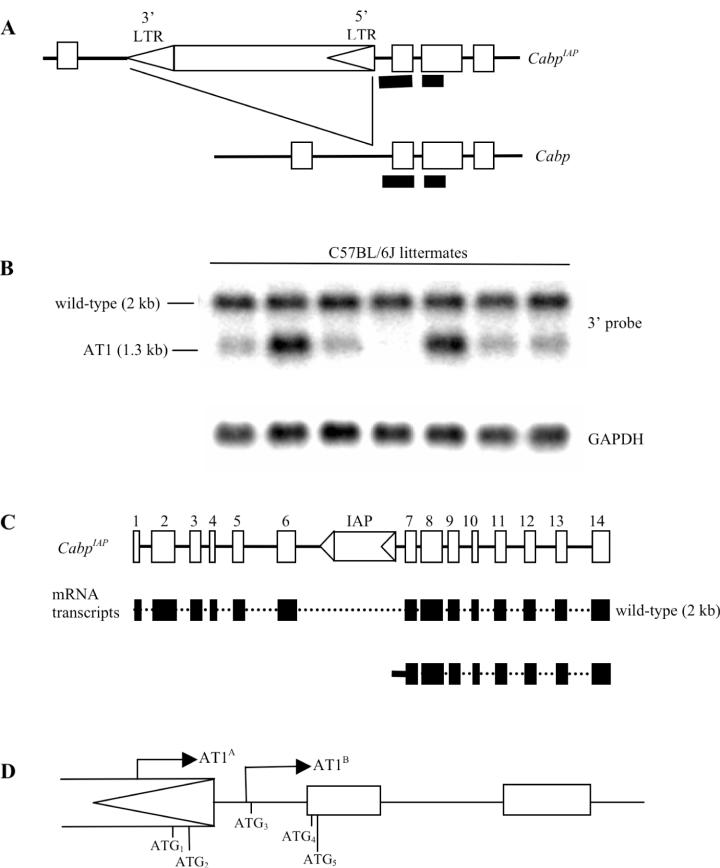
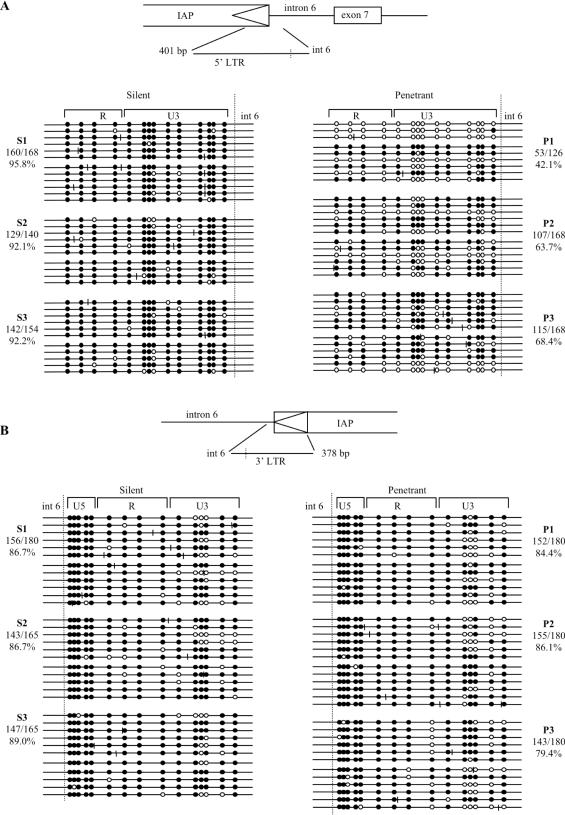
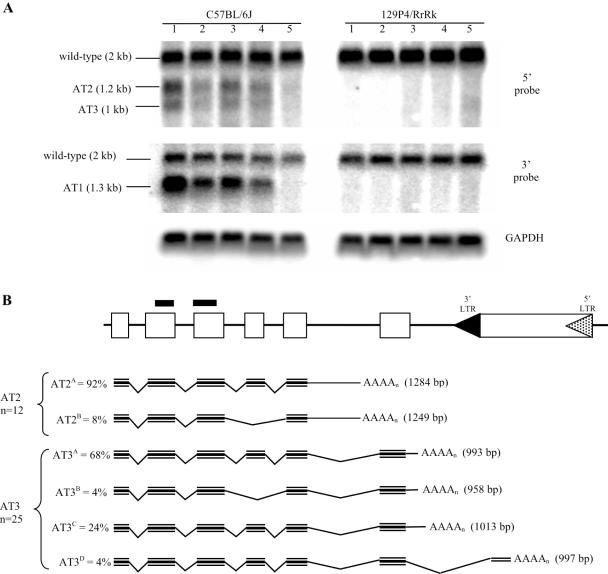
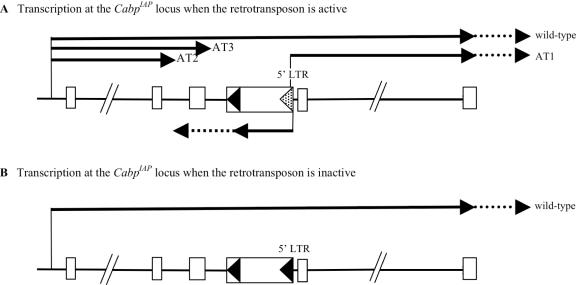
Here we report that transcriptional effects of the insertion of a retrotransposon can occur simultaneously both upstream and downstream of the insertion site. We have identified an intra-cisternal A particle (IAP) retrotransposon in intron 6 of a gene that we have named Cabp (CDK5 activator binding protein). The presence of the IAP is associated with an aberrant transcript initiating from a cryptic promoter in the IAP, reading out into the adjacent Cabp gene sequence. The expression of this transcript is highly variable among isogenic mice within the C57BL/6J strain and so Cabp(IAP) can be classified as a metastable epiallele. As expected, the presence or absence of the transcript correlates with differential DNA methylation of the 5' LTR of the IAP. More surprisingly, in mice where the retrotransposon is unmethylated and presumably transcriptionally active, we find a number of short Cabp transcripts which initiate at the normal 5' end of the gene but terminate prematurely, just 5' of the retrotransposon. This is the first report of a retrotransposon having both upstream and downstream effects on transcription at the site of insertion and it suggests that alternative polyadenylation may sometimes be caused by a downstream convergent transcription unit.


Figures

Figure 1
Figure 1
Variable expressivity of an aberrant transcript at CabpIAP. (A) The CabpIAP allele has an IAP (subtype IΔ1) in intron 6 of the gene, with the direction of transcription from the 5′ LTR (arrowhead) opposite to that of the Cabp gene. The IAP insertion site is 52 bp upstream of exon 7. The 3′ probe consists of intron 6, exons 7 and 8 (thick black lines). (B) Upper panel: Poly(A)+ northern hybridization of seven C57BL/6J mice using the 3′ probe. The 2 kb band, representing the wild-type Cabp transcript, is expressed equally amongst the littermates, whereas the aberrant transcript (AT1) is variably expressed amongst the littermates. Lower panel: GAPDH control. (C) Schematic diagram of the CabpIAP allele showing the 14 exons. The wild-type transcript contains all 14 exons, whereas AT1 which initiates in the 5′ LTR of the IAP contains LTR and intron 6 sequence and all the remaining exons (7–14). (D) 5′ RLM-RACE identified two aberrant transcripts. AT1A initiates in the 5′ LTR (76 bp upstream of the 5′ LTR/intron 6 junction) and AT1B initiates in intron 6 (22 bp downstream of the 5′ LTR/intron 6 junction). Five ATG sites are present in AT1A and three ATG sites are present in AT1B. ATG4 and ATG5 are in-frame with the Cabp coding exons and in vitro transcription/translation assays revealed that both can initiate translation.
Figure 2
Figure 2
Methylation profile of the IAP LTRs at CabpIAP. The methylation state of each CpG was obtained by sequencing PCR clones from bisulfite treated genomic DNA. Open and filled circles represent unmethylated and methylated CpGs, respectively. The position of each circle indicates the relative location of each CpG site in the DNA fragment. The short vertical lines represent the location of non-CpG cytosines that were not converted by bisulfite treatment. Each line represents the sequence of one clone. Each block of clones, which is divided into two parts, represents the data from two bisulfite PCRs from the one mouse. Clones which were identical from one PCR were discarded to avoid possible PCR bias. The numbers next to each block of clones represents the proportion of methylated CpG sites relative to the total number of CpG sites and the corresponding percentage of methylation. The data shown are from three silent (S) and three penetrant (P) C57BL/6J mice. (A) The 5′ LTR. A one-tailed, two-sample, unequal variance standard student t-test, showed the three silent mice to be different (P-value <0.05) from the three penetrant mice. (B) The 3′ LTR. A one-tailed, two-sample, unequal variance standard student t-test, showed the three silent mice to be no different (P-value >0.05) from the three penetrant mice.
Figure 3
Figure 3
Alternative polyadenylation at CabpIAP. (A) Poly(A)+ northern analysis of five C57BL/6J and five 129P4/RrRk mice. Upper panel: the membrane was hybridized with the 5′ probe [shown as two thick black lines in (B)] and shows the wild-type transcript (2 kb) and two other transcripts of 1.2 and 1.0 kb, labelled AT2 and AT3 respectively. Middle panel: the same membrane was stripped and rehybridized with the 3′ probe (see Figure 1A) and shows the wild-type and AT1 transcripts (see Figure 1B). Lower panel: GAPDH control. (B) Schematic diagram of transcripts resulting from 3′ RLM-RACE analysis of the CabpIAP allele when the 5′ LTR is hypomethylated (dotted arrowhead). 3′ RLM-RACE amplified two major PCR products (data not shown) and sequencing of these products identified six different transcripts. In order to gain insight into the relative abundance of these different transcripts, a number of clones were sequenced. The AT2 band is made up of two splice variants which terminate in intron 5. Ninety two per cent of the clones sequenced (n = 12) contained exons 1–5 and 685 bp of intron 5 (AT2A) and eight per cent of clones lacked exon 4 (AT2B). The AT3 band is made up of four transcripts. The majority of the clones (68%) sequenced (n = 25) contained exons 1–6 and 183 bp of intron 6 (AT3A), 24% of the clones contained exons 1–6 and 203 bp of intron 6 (AT3C) and 4% of clones lacked exon 4 and terminated 183 bp into intron 6 (AT3B). Another 4% of the clones sequenced (AT3D) contained exons 1–6 of the Cabp gene and 187 bp of IAP sequence. The sizes of all transcripts are indicated.
Figure 4
Figure 4
Genomic sequence indicating the truncating transcripts AT2A, AT2B, AT3A, AT3B, AT3C and AT3D. (A) Sequence showing the AT2A and AT2B transcripts which terminate at the same site in intron 5. Exon 5 is in bold and shown in uppercase and intron 5 is shown in lowercase. The polyadenylation signal (AATAAA) is double underlined. The sequence of intron 5 found in the AT2A and AT2B transcripts is underlined. AT2B lacks exon 4 (see Figure 3B). The putative termination codon (TGA) is double underlined. (B) Sequence showing the AT3A, AT3B, AT3C and AT3D transcripts. Exon 6 is in bold and shown in uppercase, intron 6 is shown in lowercase and the IAP is shown in italics and bold. In intron 6, the cryptic polyadenylation signal (ATTAAA) for AT3A, AT3B and AT3C is double underlined. The sequence of intron 6 found in the AT3A and AT3B transcripts is underlined. AT3B lacks exon 4 (see Figure 3B). The underlined dotted sequence shows the extra 20 bp present in AT3C. AT3D contains exon 6 and splices into IAP sequence. The sequence of the IAP found in the AT3D is underlined. The two possible cryptic polyadenylation signals, AGTAAA and ATTTAA for AT3D are double underlined. The putative termination codons (TGA) for all transcripts are double underlined.
Figure 5
Figure 5
Model of transcriptional interference at CabpIAP. (A) Schematic diagram of the IAP insertion at the CabpIAP allele (not to scale). Transcripts produced when the 5′ LTR of the IAP is hypomethylated (dotted arrowhead). The endogenous Cabp promoter drives expression of the Cabp wild-type transcript and the cryptic promoter in the 5′ LTR drives expression of AT1. The IAP itself is also internally transcribed by its promoter in the 5′ LTR, in an antisense direction to that of Cabp. The stable IAP mRNA transcripts terminate at the polyadenylation site in the 3′ LTR but the RNA polymerase II complex presumably reads past this site and continues into intron 6 or intron 5 (indicated by dotted arrow). Transcriptional interference between the colliding polymerases, causes premature polyadenylation of the wild-type transcripts, producing AT2 and AT3. The solid lines represent the stable mRNA transcripts and the dotted lines represent the presumed nascent transcripts. (B) Only the wild-type Cabp transcript is produced when the 5′ LTR is hypermethylated (black arrowhead).

Similar articles

Cited by

References

    1. Deininger P.L. and Batzer,M.A. (2002) Mammalian retroelements. Genome Res., 12, 1455–1465. - PubMed
    1. Ostertag E.M. and Kazazian,H.H.,Jr (2001) Biology of mammalian L1 retrotransposons. Annu. Rev. Genet., 35, 501–538. - PubMed
    1. Han J.S., Szak,S.T. and Boeke,J.D. (2004) Transcriptional disruption by the L1 retrotransposon and implications for mammalian transcriptomes. Nature, 429, 268–274. - PubMed
    1. Rakyan V.K., Blewitt,M.E., Druker,R., Preis,J. and Whitelaw,E. (2002) Metastable epialleles in mammals. Trends Genet., 18, 348–351. - PubMed
    1. Duhl D.M., Vrieling,H., Miller,K.A., Wolff,G.L. and Barsh,G.S. (1994) Neomorphic agouti mutations in obese yellow mice. Nature Genet., 8, 59–65. - PubMed

Publication types