. 2004 Nov;114(9):1281-9.
doi: 10.1172/JCI21752.

Mitochondrial remodeling in adipose tissue associated with obesity and treatment with rosiglitazone

Affiliations

Mitochondrial remodeling in adipose tissue associated with obesity and treatment with rosiglitazone

Leanne Wilson-Fritch et al. J Clin Invest. 2004 Nov.

Abstract

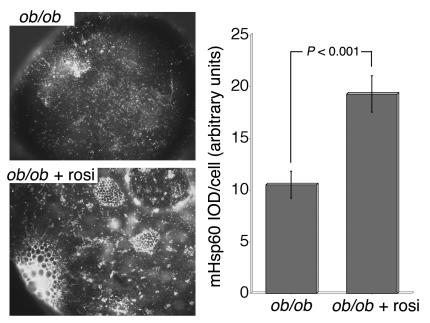
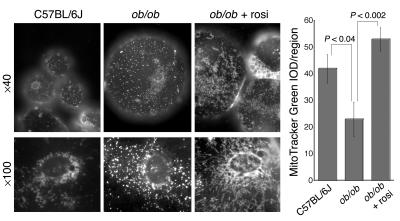
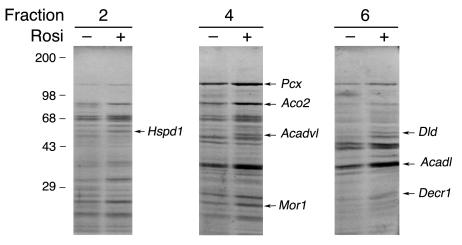
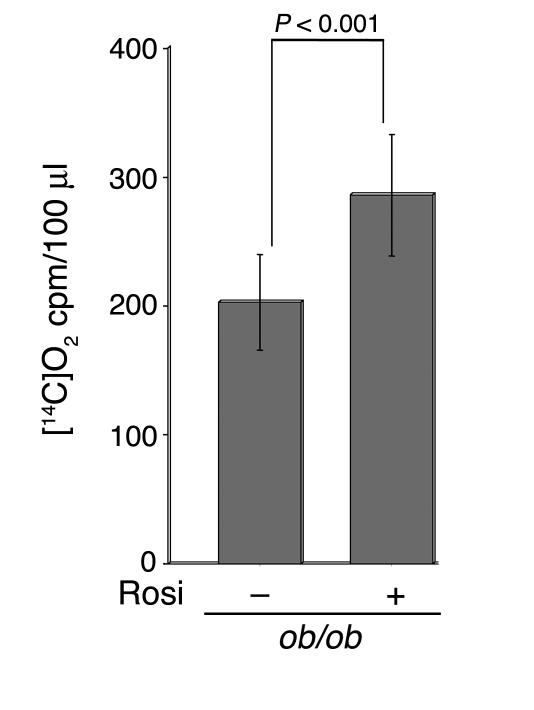
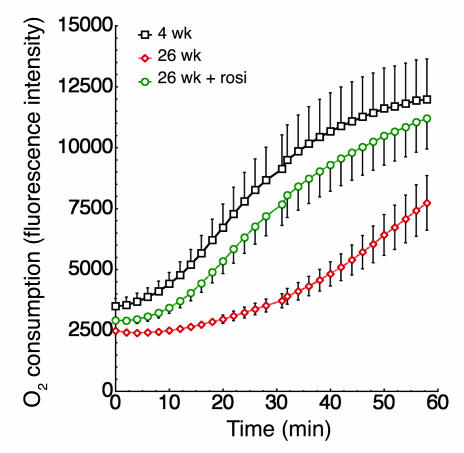
Adipose tissue plays a central role in the control of energy homeostasis through the storage and turnover of triglycerides and through the secretion of factors that affect satiety and fuel utilization. Agents that enhance insulin sensitivity, such as rosiglitazone, appear to exert their therapeutic effect through adipose tissue, but the precise mechanisms of their actions are unclear. Rosiglitazone changes the morphological features and protein profiles of mitochondria in 3T3-L1 adipocytes. To examine the relevance of these effects in vivo, we studied white adipocytes from ob/ob mice during the development of obesity and after treatment with rosiglitazone. The levels of approximately 50% of gene transcripts encoding mitochondrial proteins were decreased with the onset of obesity. About half of those genes were upregulated after treatment with rosiglitazone, and this was accompanied by an increase in mitochondrial mass and changes in mitochondrial structure. Functionally, adipocytes from rosiglitazone-treated mice displayed markedly enhanced oxygen consumption and significantly increased palmitate oxidation. These data reveal mitochondrial remodeling and increased energy expenditure in white fat in response to rosiglitazone treatment in vivo and suggest that enhanced lipid utilization in this tissue may affect whole-body energy homeostasis and insulin sensitivity.


Figures

Figure 1
Figure 1
Effects of rosiglitazone on ob/ob mice. Fasting blood glucose concentrations, whole-body weight, and isolated fat pad weight were obtained in control animals or animals treated with rosiglitazone (Rosi) for 14 days. Data were derived from 10 independent experiments in which 2–5 mice of each condition were used.
Figure 2
Figure 2
Immunofluorescence analysis of mitochondrial Hsp70. Adipocytes were isolated from the epididymal fat pads of 26-week-old C57BL/6J, ob/ob, and rosiglitazone-treated ob/ob (ob/ob + Rosi) mice. Adipocytes were fixed and stained and image stacks were obtained with a conventional wide-field microscope fitted with a 40× or 100× Nikon plan-apo objective. Images represent single optical sections. White arrows indicate small, droplet-like structures seen only in rosiglitazone-treated cells.
Figure 3
Figure 3
Immunofluorescence analysis of mitochondrial Hsp60. Isolated adipocytes from age-matched untreated and rosiglitazone-treated ob/ob mice were fixed, stained, and imaged with a conventional wide-field microscope fitted with a 40× or 100× Nikon plan-apo objective. Cell fluorescence intensity and statistical analyses were measured as described in Methods. IOD, integrated optical density.
Figure 4
Figure 4
Live cell imaging of mitochondria with MitoTracker Green FM. Adipocytes were isolated from epididymal fat pads of 26-week-old C57BL/6J or ob/ob mice that were either left untreated or were treated with rosiglitazone for 14 days. Cells were incubated with 100 nM MitoTracker Green FM for 30 minutes and 25 μl of the cell suspension was placed on a microscope slide. A glass coverslip was floated on the cell suspension and images were acquired within 5 minutes using a conventional wide-field microscope fitted with a ×40 or ×100 Nikon plan-apo objective.
Figure 5
Figure 5
Analysis of gene expression changes in adipocytes from ob/ob mice. Total RNA was extracted from isolated adipocytes from 4-week-old (4 week) untreated, 26-week-old (26 week) untreated, and 26-week-old rosiglitazone-treated ob/ob mice and was used to probe the murine U74v2 Affymetrix GeneChip. The resulting data were queried using probe annotations within the Affymetrix database. vs., versus.
Figure 6
Figure 6
Comparative analysis of mitochondrial protein expression in untreated and rosiglitazone-treated adipocytes. Mitochondria isolated from adipocytes from untreated (–) and rosiglitazone-treated (+) ob/ob mice were analyzed by sucrose gradient centrifugation and SDS-PAGE. Proteins exhibiting substantial differential expression in three independent experiments were excised and identified by mass spectrometry. Illustrated is one experiment from which the indicated proteins were excised. They are identified along the left margins by their respective gene symbols.
Figure 7
Figure 7
Western blotting of mitochondrial proteins. Isolated adipocytes were lysed in sample buffer containing 1% SDS. Equal concentrations of total protein (20 μg) were analyzed by SDS-PAGE and Western blotting using antibodies against mitochondrial (CytC, cytochrome c; COX, cytochrome oxidase subunit II; mHsp60) and non-mitochondrial (Chc, clathrin heavy chain; Actin) proteins. Except where indicated by the asterisk, all samples were from ob/ob mice with the ages and conditions indicated. Band intensities were quantified using Photoshop 7 software as described in Methods and were plotted. Similar results were obtained in three experiments.
Figure 8
Figure 8
Fatty acid oxidation in isolated adipocytes. Adipocytes were isolated from 26-week-old untreated or rosiglitazone-treated ob/ob mice. Palmitate oxidation was estimated by the measurement of [14C]O2 release over a 2-hour period as described in Methods. The numbers of cells present in 100 μl of packed volume, estimated by direct DNA measurements, were 5.4 × 10⁵ and 5.1 × 10⁵ in the absence and presence of rosiglitazone treatment, respectively.
Figure 9
Figure 9
Oxygen consumption in isolated adipocytes. Adipocytes were isolated from 4-week-old, 26-week-old untreated, or 26-week-old rosiglitazone-treated ob/ob mice. Equal volumes of packed cells were separated into aliquots in wells of a 96-well BD Oxygen Biosensor plate. Plates were covered and fluorescence in each well was recorded over time with a Tecan SAFIRE multimode microplate spectrophotometer. The averages are plotted, and vertical lines represent the SEM of four independent experiments performed in triplicate. The number of cells contained in equal volumes was not statistically significantly between conditions.
Figure 10
Figure 10
PGC-1α expression in epididymal fat. Total RNA was prepared from fat pads from ob/ob mice before (–) and after (+) rosiglitazone treatment and was subjected to Northern blotting with a 32P-labeled mouse PGC-1 cDNA fragment as a probe.

References

    1. Argyropoulos G, Harper ME. Uncoupling proteins and thermoregulation. J. Appl. Physiol. 2002;92:2187–2198. - PubMed
    1. Cannon B, Nedergaard J. Brown adipose tissue: function and physiological significance. Physiol. Rev. 2004;84:277–359. - PubMed
    1. Rajala MW, Scherer PE. Minireview: the adipocyte—at the crossroads of energy homeostasis, inflammation, and atherosclerosis. Endocrinology. 2003;144:3765–3773. - PubMed
    1. Friedman JM. The function of leptin in nutrition, weight, and physiology. Nutr. Rev. 2002;60:S1–S14; discussion S68–S84, S85–S17. - PubMed
    1. Wilson-Fritch L, et al. Mitochondrial biogenesis and remodeling during adipogenesis and in response to the insulin sensitizer rosiglitazone. Mol. Cell. Biol. 2003;23:1085–1094. - PMC - PubMed

Publication types

MeSH terms