. 2004 Nov 9;101(45):15938-43.
doi: 10.1073/pnas.0407044101. Epub 2004 Nov 2.

Model for anaphase B: role of three mitotic motors in a switch from poleward flux to spindle elongation

Affiliations

Model for anaphase B: role of three mitotic motors in a switch from poleward flux to spindle elongation

I Brust-Mascher et al. Proc Natl Acad Sci U S A. .

Abstract

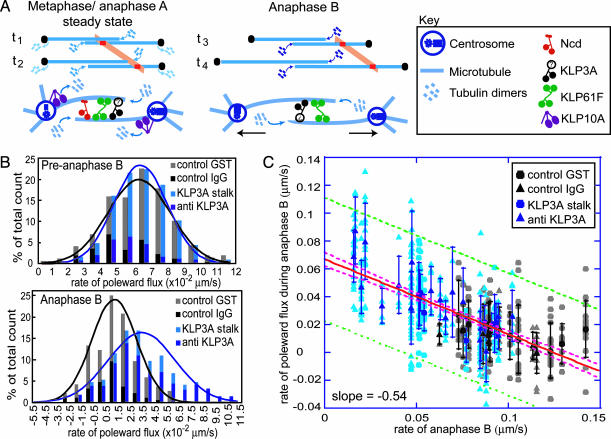
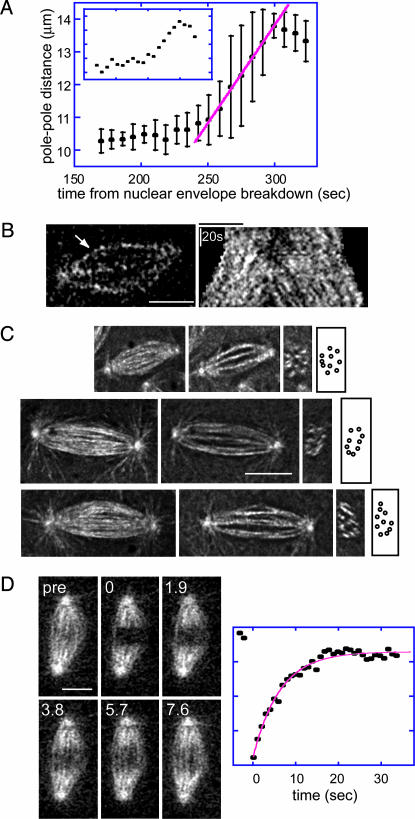
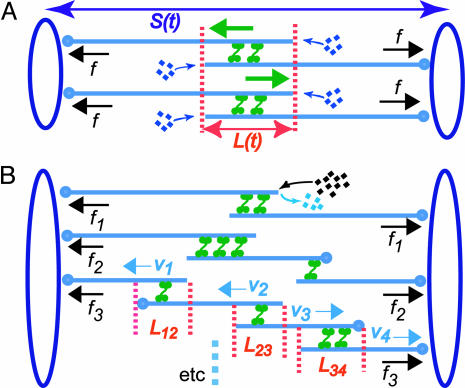
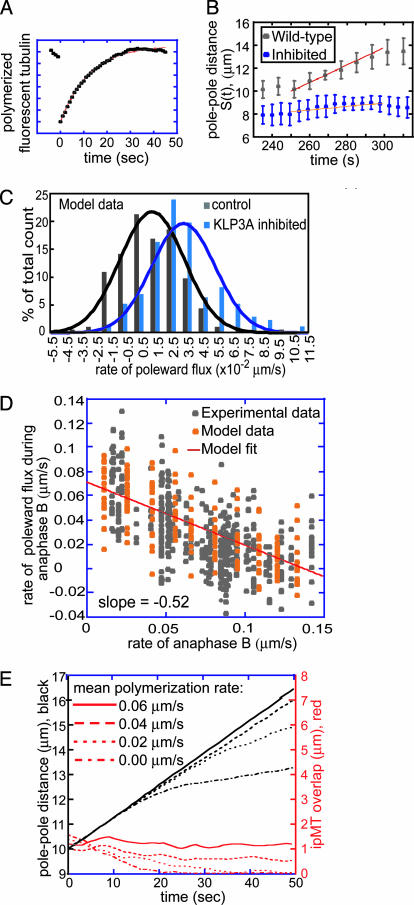
It has been proposed that the suppression of poleward flux within interpolar microtubule (ipMT) bundles of Drosophila embryonic spindles couples outward forces generated by a sliding filament mechanism to anaphase spindle elongation. Here, we (i) propose a molecular mechanism in which the bipolar kinesin KLP61F persistently slides dynamically unstable ipMTs outward, the MT depolymerase KLP10A acts at the poles to convert ipMT sliding to flux, and the chromokinesin KLP3A inhibits the depolymerase to suppress flux, thereby coupling ipMT sliding to spindle elongation; (ii) used KLP3A inhibitors to interfere with the coupling process, which revealed an inverse linear relation between the rates of flux and elongation, supporting the proposed mechanism and demonstrating that the suppression of flux controls both the rate and onset of spindle elongation; and (iii) developed a mathematical model using force balance and rate equations to describe how motors sliding the highly dynamic ipMTs apart can drive spindle elongation at a steady rate determined by the extent of suppression of flux.


Figures

Fig. 1.
Fig. 1.
Qualitative model for anaphase B and experimental test of the model. (A) Dynamics of spindle poles (black dots), ipMTs (overlapping blue lines) that add or lose tubulin subunits (blue), and tubulin speckles (orange) at time points t1 and t2 (preanaphase B) and t3 and t4 (anaphase B). In preanaphase B, pole–pole spacing remains constant, and opposite end assembly/disassembly is associated with poleward flux (orange). In anaphase B, depolymerization at the poles ceases, and ipMT sliding drives pole–pole separation; thus, speckles move away from the equator at the same rate as the poles. In the molecular model of anaphaseB, the turning off of depolymerization at the poles by inhibiting KLP10A allows KLP61F-driven ipMT sliding to push the poles apart. KLP3A organizes ipMTs into bundles, whereas the braking action of Ncd is turned off before anaphase B onset. (B) Histograms of the rates of flux in preanaphase B (Upper) and anaphase B(Lower) spindles in control (gray) and KLP3A-inhibited (blue) embryos. The number of counts was normalized to the total number. Note that there are large variations in the flux rate, and when the mean is near zero, some values are negative. (C) During anaphase B, the rates of poleward flux and spindle elongation are linearly inversely related. Data points display the behavior of individual fluorescent tubulin speckles within individual spindles of control (gray) and KLP3A-inhibited (blue) embryos; darker symbols represent the mean for each spindle. The red line is the best fit to the data; the pink and green dashed lines are the 95% confidence intervals for the best fit line and data points, respectively.
Fig. 2.
Fig. 2.
Organization and dynamics of ipMT bundles in Drosophila embryonic anaphase B spindles. (A) Pole–pole separation versus time during preanaphase B (160–250 sec) and anaphase B (250–300 sec). Spindle elongation is linear. Main graph, average data from multiple spindles; the standard deviation arises from variations in the linear rate between different spindles. (Inset) Typical spindle. Red line, regression line fit to the mean. (B) FSM of ipMT bundles. The kymograph (Right) during preanaphase B and anaphase B [for the bundle indicated by the arrow (Left) during anaphase B] shows that tubulin speckles flux away from the equator throughout. (C) ipMTs. Longitudinal projections (Left), XY sections (Center Left), transverse sections (Center Right), and cartoons of transverse sections (Right) reveal approximately nine ipMT bundles per spindle. (D) MT turnover determined by FRAP. Micrographs of a spindle before (pre) and after (time in seconds) photobleaching (Left) and the plot of fluorescence intensity (arbitrary units) versus time after photobleaching (Right) reveal that tubulin turnover in the central spindle is fast (recovery half time of 4.5 sec in this example). (Bar, 5 μm.)
Fig. 3.
Fig. 3.
Model spindle geometry. (A) A simplified spindle with two identical arrays of ipMTs, each composed of two overlapping antiparallel MTs. Here, ipMTs have the same overlap, and their plus ends polymerize at the same rate. S(t) is the pole–pole distance, and L(t) is the length of the ipMT overlap. Green arrows indicate sliding of ipMTs by bipolar motors; black arrows indicate the motor-generated forces, equal to f for both ipMT arrays. (B) A realistic spindle with ipMT arrays composed of two, three, and four overlapping MTs. In the lower ipMT array, the overlap length between the parallel (L12 and L34) and antiparallel (L23) MTs and the sliding velocity of each MT (V1, V2, V3, and V4) is indicated. The dynamic instability of the plus ends, resulting in an average net polymerization, is shown only for the left MT in the top ipMT array. Forces generated by bipolar motors in different ipMT arrays (e.g., f1, f2, and f3) are different.
Fig. 4.
Fig. 4.
Model results. (A) FRAP simulation. formula image = 0 μm/sec. (B) Experimental and theoretical plots of pole–pole separation [S(t)] versus time during anaphase B. Control (gray) and KLP3A-inhibited (blue) data and theoretical curves (red, control; orange, KLP3A-inhibited). formula image = 0.015 and 0.055 μm/sec for control and KLP3A-inhibited embryos, respectively. (C) Histograms of the rates of flux in anaphase B in control (gray) and KLP3A-inhibited embryos (blue) obtained by numerical solutions. formula image = 0–0.03 and 0.02–0.07 μm/sec for control and KLP3A-inhibited embryos, respectively. The flux rate exhibits large variances similar to the experimental data (Fig. 1B). (D) Numerical results for the flux and spindle elongation rates in spindles where formula image alone has been varied (formula image = 0–0.07 μm/sec). The model solutions (orange) are superimposed on the data from Fig. 1C (gray). (E) Plots of pole–pole distance [S(t), black] and ipMT overlap [L(t), red] for various rates of formula image. During the first half of anaphase B, the poles separate steadily at a velocity independent of the polymerization rate (formula image). However, the ipMT overlap is affected by formula image. Note the small fluctuations in L(t) due to dynamic instability. The catastrophe frequency was varied as 0.04, 0.08, 0.16, and 0.2/sec to yield the indicated polymerization rates. formula image = 0 μm/sec. The initial average overlap is 1–1.5 μm, n = 30, frescue = 0.2/sec, and fcatastrophe = 0.02/sec, unless indicated otherwise. All unspecified parameter values are given in Table 2.

References

    1. Scholey, J. M., Brust-Mascher, I. & Mogilner, A. (2003) Nature 422, 746–752. - PubMed
    1. Masuda, H., McDonald, K. & Cande, W. Z. (1988) J. Cell Biol. 107, 623–633. - PMC - PubMed
    1. McIntosh, R. & McDonald, K. L. (1989) Sci. Am. 261, 48–56. - PubMed
    1. Mastronarde, D. N., McDonald, K. L., Ding, R. & McIntosh, J. R. (1993) J. Cell Biol. 123, 1475–1489. - PMC - PubMed
    1. Hogan, C. J., Wein, H., Wordeman, L., Scholey, J. M., Sawin, K. E. & Cande, W. Z. (1993) Proc. Natl. Acad. Sci. USA 90, 6611–6615. - PMC - PubMed

Publication types